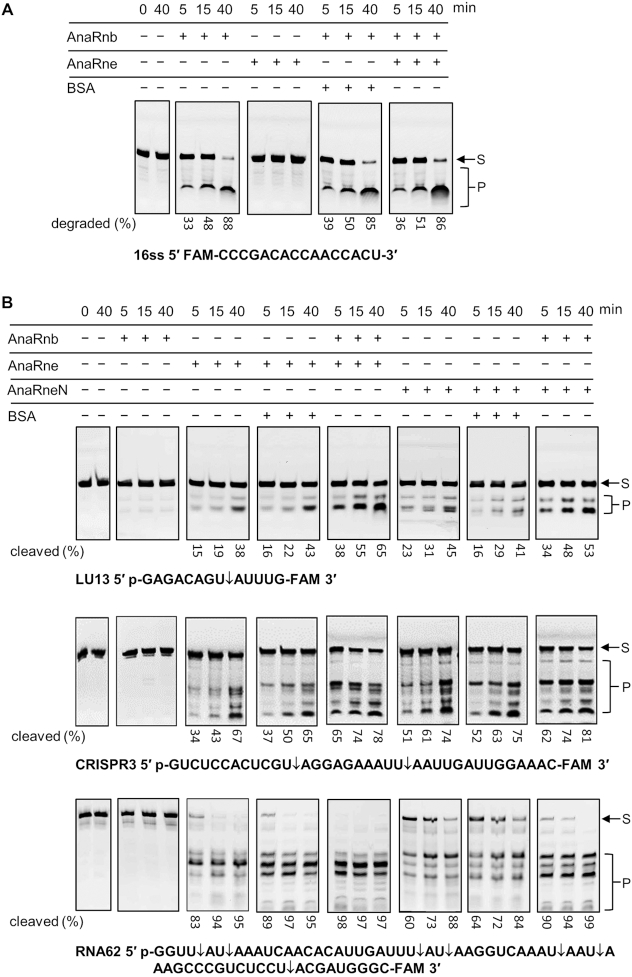
Figure 6.
The effect of AnaRnb and AnaRne interaction on their ribonucleolytic activities. (A) Testing the influence of AnaRne on the exoribonuclease activity of AnaRnb on the 5′ FAM-labeled 16-base single-stranded RNA 16ss. AnaRne or BSA at 10 nM was included in the indicated reactions. (B) Testing the influence of AnaRnb on the endoribonuclease activity of AnaRne on the 5′-monophosphorylated and 3′ FAM-labeled substrates of LU13, CRISPR3 and RNA62. The major cleavage sites in the substrates are indicated by rightwards arrows. The positions of the bands corresponding to intact substrates (S) and the degradation/cleavage products (P) are indicated on the right. The numbers below the gel lanes are the percentages of degraded/cleaved products in the corresponding reactions, which were calculated based on the intensity of the gel bands quantified using ImageJ (https://imagej.nih.gov/ij). All the reactions were performed at 30°C for the indicated time periods. AnaRne at 10 nM or AnaRneN at 100 nM was added in the indicated reactions, and BSA at the same concentrations was included as the control reactions. Each reaction mixture contained 50 nM RNA substrate.

