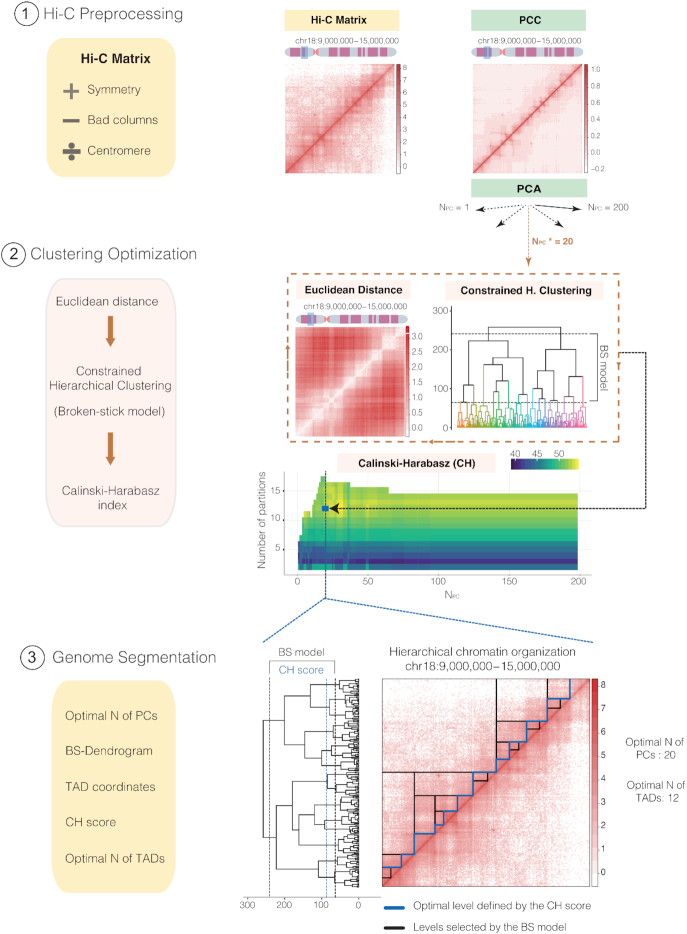
Figure 1.
General overview of TADpole tool. Schematic overview of the TADpole algorithm. (1) TADpole input is an all-versus-all tab-limited Hi-C matrix. The matrix is checked for symmetry and low-quality columns (called as bad columns—BC) are removed. Large matrices of entire chromosomes are optionally split at the centromere to create two smaller sub-matrices corresponding to the chromosomal arms. Next, matrix denoising and dimensionality reduction take place by computing the corresponding PCC matrix, and by performing a PCA on it. (2) Per each number of first PCs retained (from 1 to 200), the corresponding PC matrix is transformed into its Euclidean distance matrix (EDM). The EDM serves as the input to perform the constrained hierarchical clustering (CH-clust). The range of significant hierarchical levels is fixed from level 1 (corresponding to partitioning the region into 2 TADs) up to an upper bound given by the broken-stick model (BS), then the Calinski-Harabasz (CH) index is used to select the optimal level. (3) As output, TADpole returns the optimal number of first PCs (Npc*) retained to obtain the optimal set of TADs, the dendrogram with the significant hierarchical levels, the coordinates of the chromatin domains for each level with its associated CH index, and the optimal number of TADs. A real example of TADpole tool applied to a 6Mb-region (chr18:9,000,000–15,000,000) of a human Hi-C dataset (HIC003; SRR1658572) at 30 kb resolution obtained from Rao et al. (15). Two bad columns were detected and removed from the input data and then, the PCC and the PCA were computed (using the first 200 PCs). Using the first 20 PCs, the EDM is computed and is used as the input for the CH-clust. A total of 16 hierarchical levels are retrieved according to the BS model and, for each one, the CH index is computed (this process is repeated iteratively for each set of PCs analyzed). This step produces a matrix of CH indexes (with the result of the 200 computed dendrograms) from which the highest average score is selected (highlighted with the blue square), in this case corresponding to 12 TADs and the first 20 PCs (Npc*). Taking these values, a complete dendrogram of the Hi-C matrix is retrieved, cut using the broken-stick model to select significant levels (containing from 2 to 17 TADs, shown between black lines) and, from them, the highest-scoring level according to the CH index is selected (blue line). On the right, the Hi-C contact map is presented showing the complete hierarchy of the significant levels selected by the BS model (black lines) along with the optimal one in 12 specific TADs, as identified by the highest CH index (blue line).

