Figure 4.
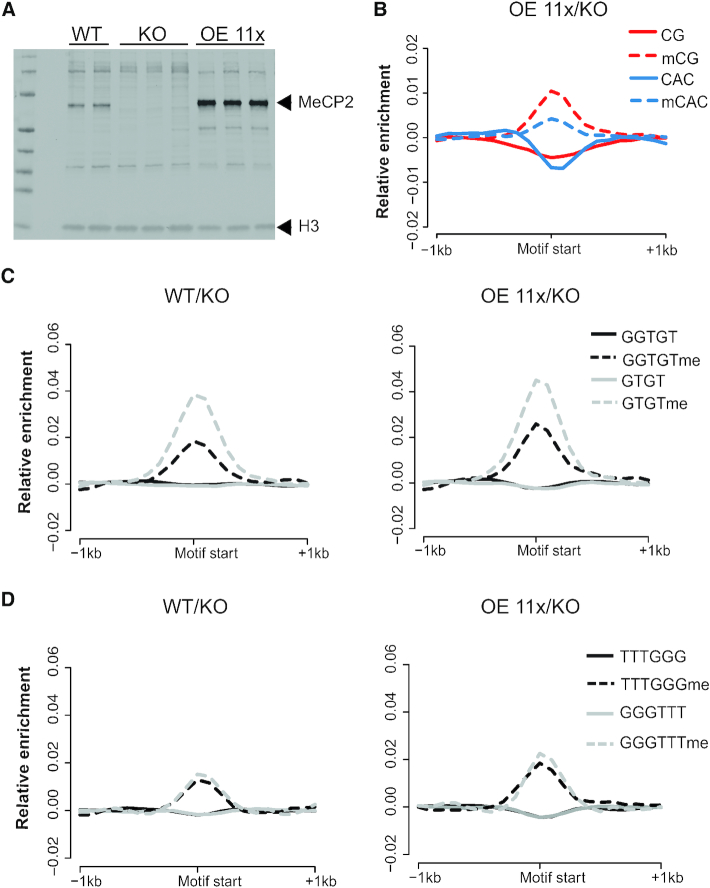
Native MeCP2 is not enriched at GT-rich sequences in vivo. (A) Western blot showing expression level of MeCP2 in WT, MECP2 knockout (KO) and 11-fold over-expressing (OE 11x) human neuronal cells in culture (see reference (10)). Replicates are independent cloned cell lines. (B) Composite plots showing log2 enrichment of MeCP2 over windows containing methylated or unmethylated CG (red broken or solid lines, respectively) and methylated or unmethylated CAC (blue broken or solid lines, respectively) that are otherwise free of methylation. (C) Composite plots showing log2 enrichment of MeCP2 over GTGT- containing (grey) and GGTGT-containing (black) windows that do (dashed lines) or do not (solid lines) contain cytosine methylation elsewhere. WT (left panel) and OE 11x (right panel) reads are normalised to KO. (D) Composite plots showing log2 enrichment of MeCP2 over windows containing GGGTTT (grey) and TTTGGG (black) that do (dashed lines) or do not (solid lines) contain cytosine methylation elsewhere. WT (left panel) and OE 11x (right panel) are normalised to KO.

