Figure 5.
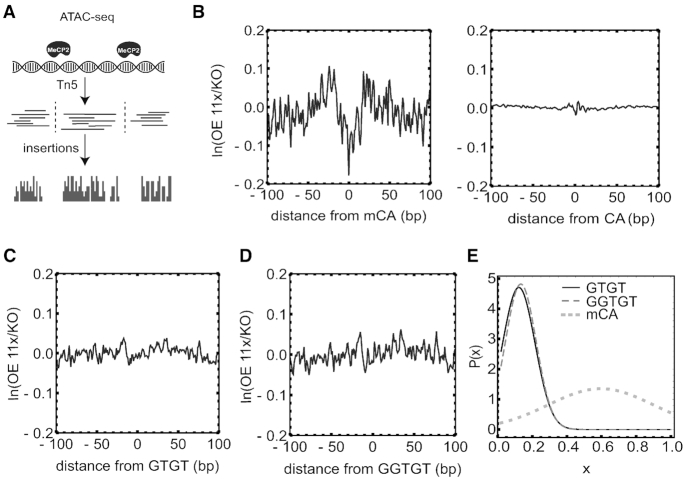
Absence of an ATAC-seq footprint of MeCP2 at GT-rich sequences in native chromatin. (A) A schematic representation of the ATAC-seq procedure and footprint analysis. (B) ATAC-seq insertion profile shows a MeCP2 footprint over mCA (left) but no footprint over non-methylated CA (right). (C) and (D) Absence of footprint at GTGT (left) and GGTGT (right), respectively. (E) Bayesian posterior probability distribution (P[x]) of the GTGT binding probability versus GTGT binding strength relative to mCG binding (x) that best reproduces the experimental ATAC-seq insertion profile. For comparison P[x] for mCA is shown (dotted line).

