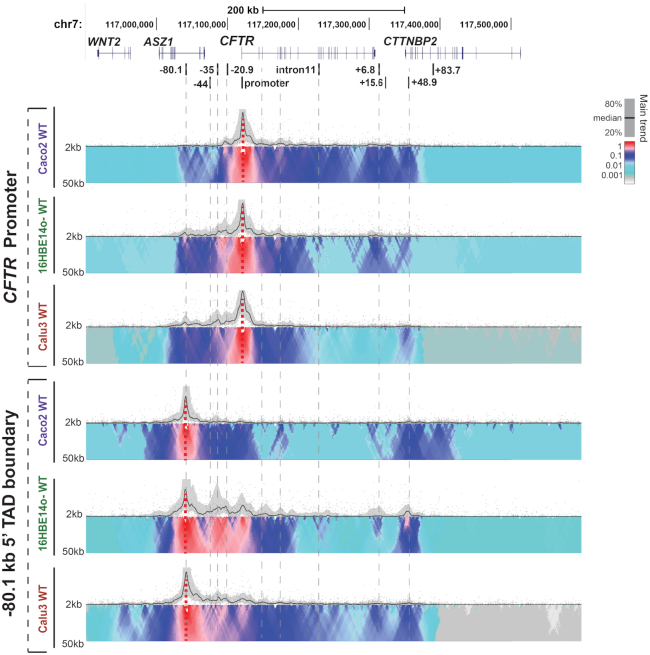
Figure 2.
Airway epithelial cell chromatin architecture at the CFTR locus: 4C-seq data are shown for Caco2, 16HBE14o- and Calu3 cell lines. At the top the genomic location of CFTR and adjacent genes on chromosome 7 are shown together with known CFTR cis-regulatory elements. Below, 4C-seq data are shown for each cell line using viewpoints at the CFTR promoter (upper) and the −80.1 kb 5′ TAD boundary (lower). The 4C-seq data show the main trend of contact profile using a 5-kb window size as a black line above the domainogram. Relative interactions are normalized to the strongest point (which is set to 1) within each panel. The domainogram uses color-coded intensity values to show relative interactions with window sizes varying from 2 to 50 kb. Here, red denotes the strongest interactions and dark blue, through turquoise, to gray represent decreasing frequencies.

