Figure 5.

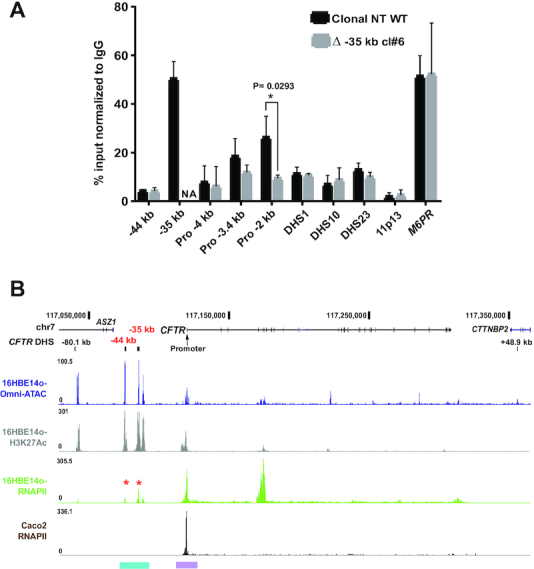
The −35 kb enhancer region binds RNAPII. (A) ChIP for RNAPII in non-targeted (NT) WT (black) and Δ −35 kb (grey) 16HBE14o- clones. RNAPII occupancy shown by qPCR using primers for CREs across the CFTR locus (−44, −35 kb, promoter regions (−4, −3.4 and −2 kb), intron 1 DHS, intron 10ab DHS, intron 23 DHS (12)). Negative and positive controls were an inactive region of chr11p13 (49), and the M6PR gene promoter, respectively. Results are n = 3 comparing a NT WT and Δ −35 kb clone #6. Error bars represent S.E.M. (B) RNAPII occupancy by ChIP-seq in 16HBE14o- (Olive green) and Caco2 (Brown) cell lines with Omni ATAC-seq and H3K27Ac ChIP-seq panels for 16HBE14o- as marked. The −44, −35 kb regions and the promoter region are highlighted in cyan and purple respectively (color scheme and UCSC browser configuration as in Figure 1).
