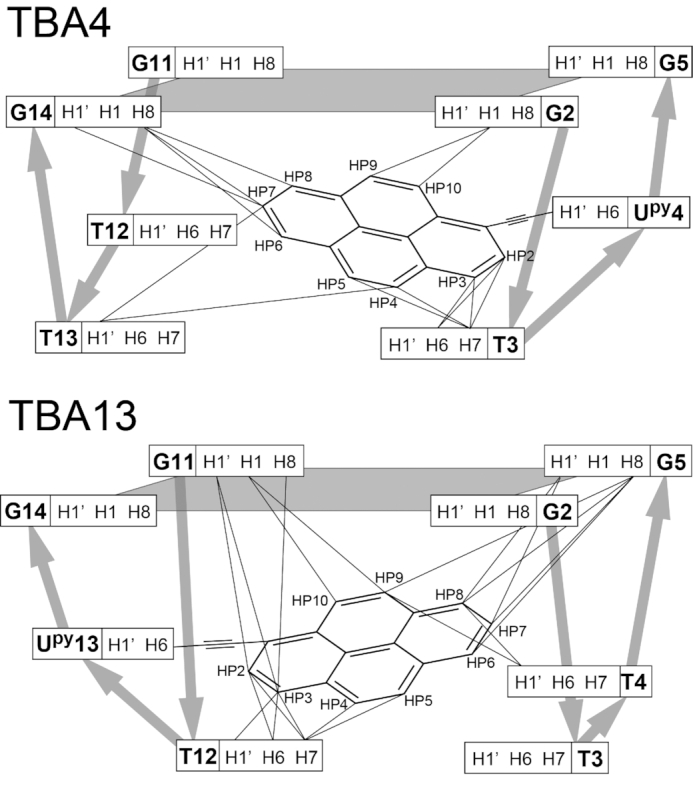
Figure 6.

Schematic presentation of all internucleotide NOE correlations with pyrene groups in TBA4 (top) and TBA13 (bottom) G-quadruplexes observed in NOESY spectra (τm = 250 ms). G-quartet planes are shaded. Broad silver arrows show the direction of the phosphodiester backbone.
