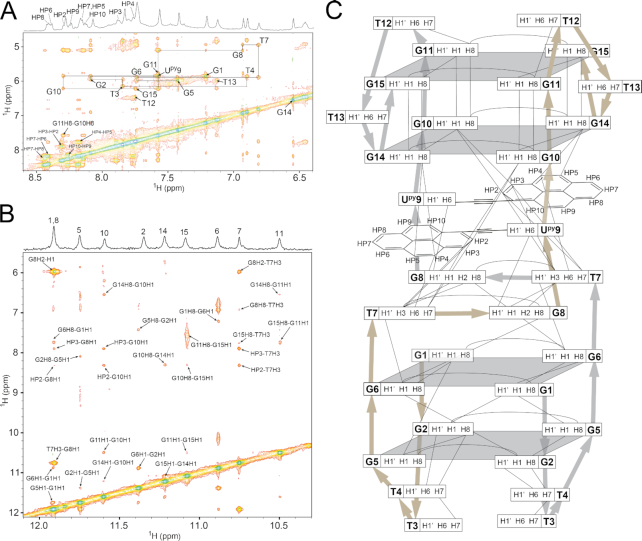
Figure 8.
Spectral regions of a NOESY spectrum (τm = 250 ms) of TBA9D. (A) Aromatic-anomeric region where annotated cross-peaks represent intranucleotide H8/H6-H1′ NOE contacts. (B) NOESY region containing imino proton contacts to pyrene, aromatic and d-ribose protons. (C) Schematic representation of observed internucleotide NOE correlations for the TBA9D G-quadruplex. Broad silver and gold arrows show the direction of the phosphodiester backbone in both TBA9 DNA strands.

