Figure 2.
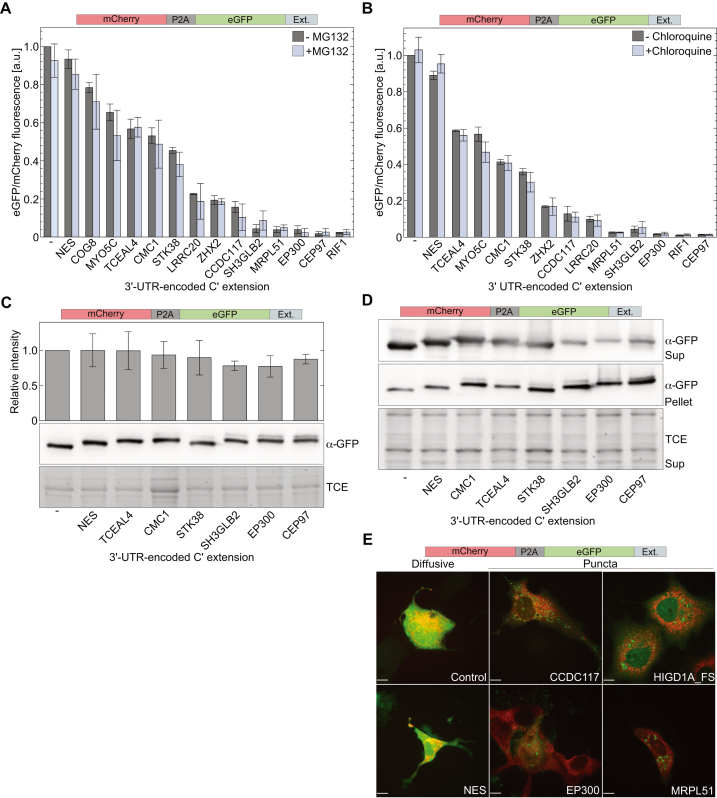
3′-UTR-encoded C-terminal extensions promote aggregation of extended proteins. (A and B) Effect of proteasome inhibition and chloroquine on cellular levels of soluble eGFP with 3′-UTR-encoded C-terminal extension. Transfected HEK293T cells were cultured for 16 h in the presence of MG132 (A) or 40 h in the presence of chloroquine (B). Cellular levels of indicated C-terminally extended eGFP variants were determined from the ratio between fluorescence intensities of soluble eGFP and mCherry. (C) Total levels of eGFP with 3′-UTR-encoded C-terminal extension. HEK293T cells expressing mCherry-P2A-eGFP with indicated C-terminal extension were boiled in 2×sample buffer 48 h post-transfection and clear samples were analyzed by SDS-PAGE. Bars represent immunoblot intensities (mean ± S.D. of three independent measurements) normalized to total protein load (using TCE). (D) Distribution of eGFP between soluble and insoluble fractions. Soluble (Sup) and insoluble (Pellet) fractions of HEK293T lysates prepared with Triton×-100, were boiled in 2×SDS sample buffer before analysis. Depletion of eGFP from soluble fractions was accompanied by increased levels in insoluble fractions. TCE fluorescence of soluble fraction was used as a loading control. (E) Spatial distribution of eGFP with 3′-UTR-encoded C-terminal extension. COS7 cells co-expressing mCherry-P2A-eGFP with indicated C-terminal extensions and ER-E2-Crimson for ER labeling (red channel) were visualized by fluorescence confocal microscopy 48 h post-transfection. Soluble eGFP (control, NES) displayed a diffusive phenotype, while eGFP with 3′-UTR-encoded C-terminal extensions that promoted depletion from soluble fractions, formed green fluorescent puncta. No overlap was found between eGFP puncta and ER (red). Scale bar = 10 μm.

