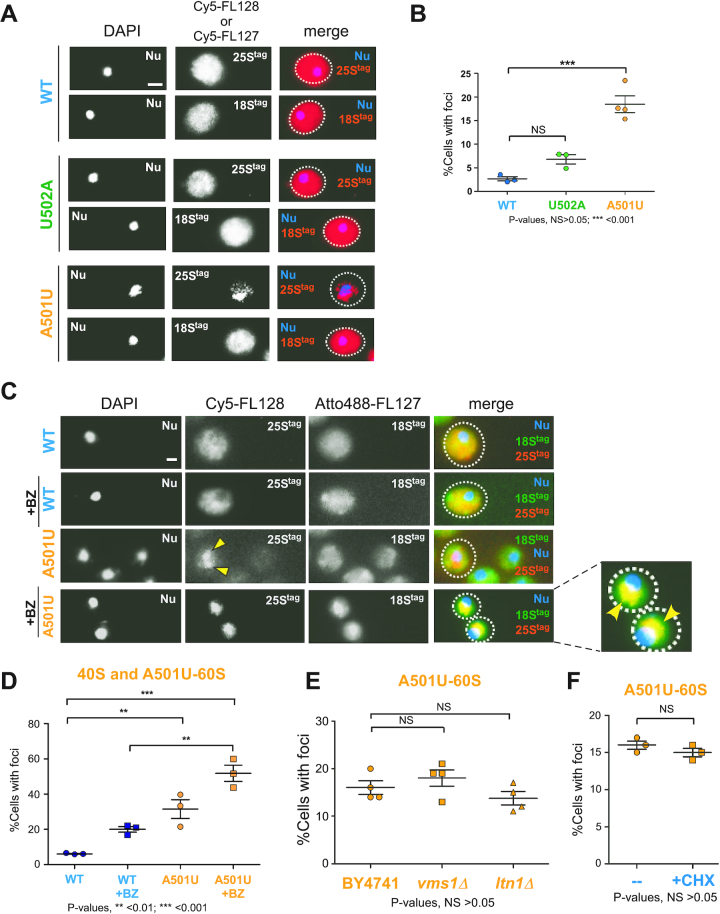
Figure 6.
Sequestration into ribosome-enriched foci involves both 40S and 60S-A501U subunits and is not a part of 60S-RQC. (A) BY4741 cells expressing indicated 25Stag rRNAs were analyzed by RNA-FISH using probes against 18Stag (Cy5-FL127) and 25Stag (Cy5-FL128) rRNAs. Scale bar, 2 μm. (B) Percentage of cells with 25Stag rRNA foci in cell populations transformed with the indicated mutant 25S rRNA constructs (n > 100 cells). Mean values and standard errors are shown, P values were determined by one-way ANOVA plus Dunnett's multiple comparisons test, NS is non-significant. (C) Cells were grown as in (A), and half of each culture was treated with 50 μM Bortezomib (BZ) for 1 h. 25Stag rRNA was visualized by FISH with the Cy5-FL128 probe, while 18Stag rRNA was visualized with the Atto 488-FL127 probe. An enlarged image for 18Stag and 25Stag-A501U rRNAs co-staining after BZ treatment is shown on the right. Yellow arrows point to the A501U-ribosome enriched foci. DAPI staining visualizes the nucleus (Nu). Representative microscopy fields are shown; scale bar, 2 μm. (D) Percentage of cells with 25Stag rRNA foci in cell populations expressing the indicated 25Stag rRNA constructs treated or untreated with BZ for 1 h (n > 100 cells). Mean values and standard errors are shown, P values were determined by one-way ANOVA plus Dunnett's multiple comparisons test. (E) pDP333 containing 25Stag-A501U rRNA was transformed into wild-type BY4741, ltn1Δ and vms1Δ strains; transformants were grown as in (A), cells were analyzed by FISH with the Cy5-FL128 probe. Percentages of cell populations displaying 25Stag rRNA foci were quantified for each strain tested (n>200 cells). Mean values and standard errors are shown, P values were determined by one-way ANOVA plus Dunnett's multiple comparisons test, NS is non-significant. (F) BY4741 cells containing 25Stag-A501U rRNA were grown as in (A), one half of this culture was treated with 50 μg/ml cycloheximide (CHX) for 1 h prior to FISH with the Cy5-FL128 probe. Cells containing foci were quantified as in (E), >200 cells were analyzed. P value was determined by Mann Whitney test, NS is non-significant.

