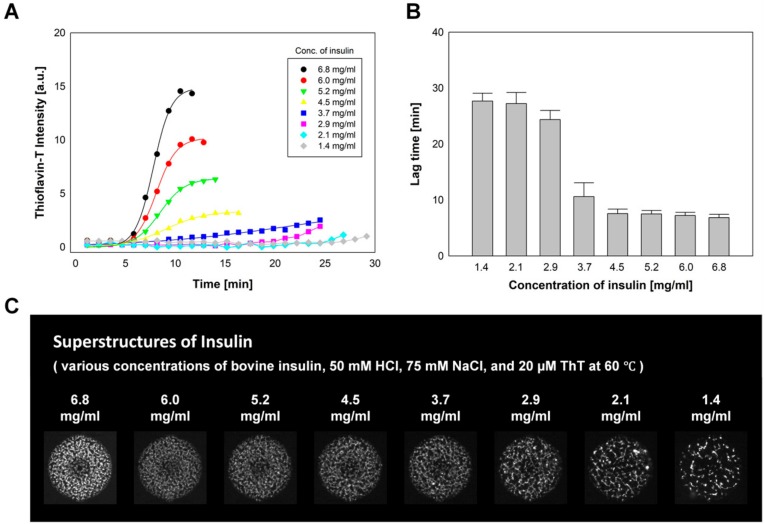
Figure 3.
The effect of insulin concentration on insulin fibrillation. (A) The fluorescent intensity changes of ThT as a marker of insulin fibrillation. (B) Average lag times for insulin fibril formation (n = 8) and (C) the formation of insulin superstructures at various concentrations of insulin (50 mM HCl, 75 mM NaCl, and 20 µM ThT).

