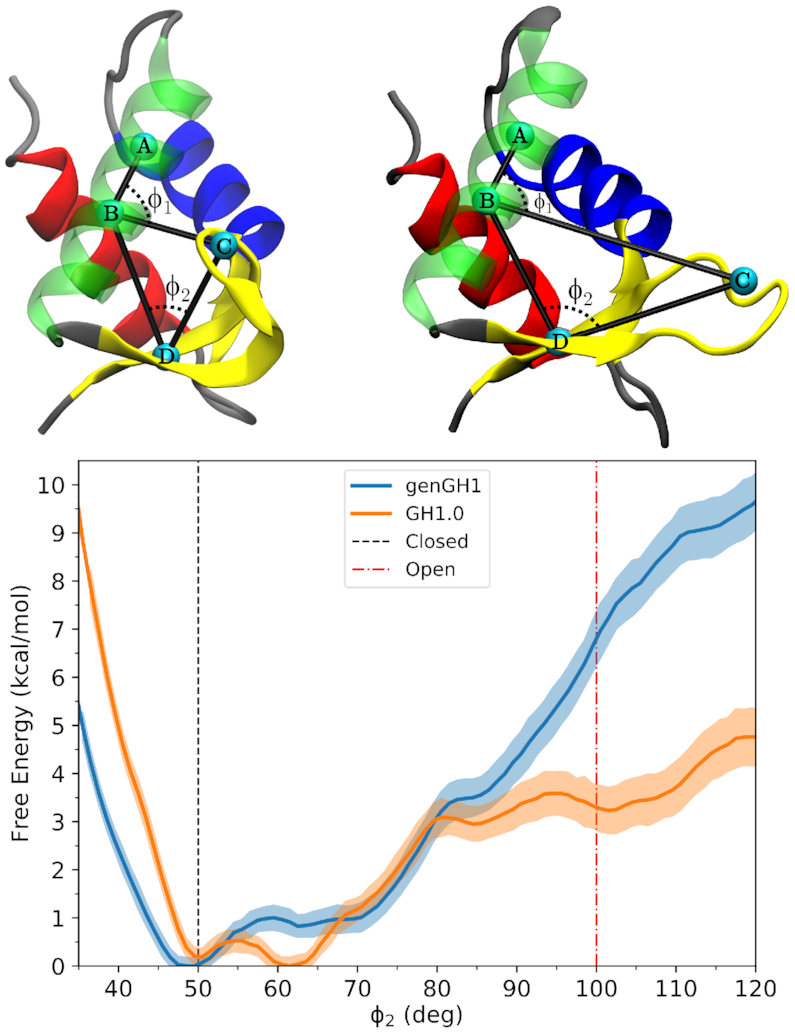
Figure 3.

Potential of mean force from umbrella sampling simulations showing the relative free-energy landscapes between genGH1 and GH1.0 along the ϕ2 coordinate space. The red dotted-line corresponds to the closed-state angle, ϕ2 = ∼50.0°, while the green dotted-line corresponds to the open-state angle, ϕ2 = ∼100.0°, of the crystalographic closed-state from 1HST.
