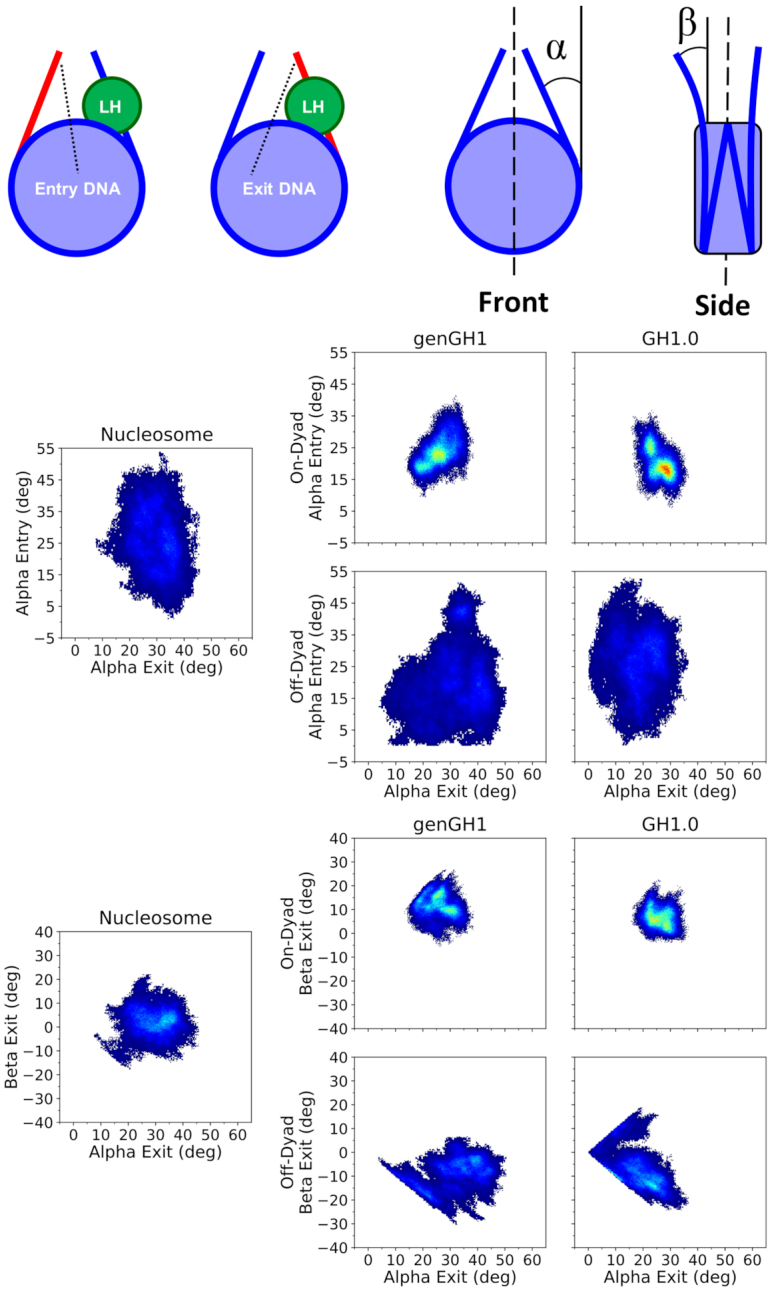
Figure 6.

Density plots of linker DNA α and β angles. Entry and Exit DNA (from left to right) are defined in the top left graphic. The linker histone (LH) is shown in green, the linker DNA arm in red, while the rest of the nucleosome is blue. To the right are the α and β definitions (from left to right), which were inspired by Bednar et al. (34). The dyad axis is shown as a black dotted line. Each plot shows a 2D histogram of the entry linker DNA angles versus the exit linker DNA angles for both α (middle set of plots) and β (bottom set of plots) angles, with density ranges from dark blue (lowest) to red (highest). Each plot contains the linker DNA from the nucleosome core particle along with genGH1 and GH1.0 in the on- and off-dyad binding modes.
