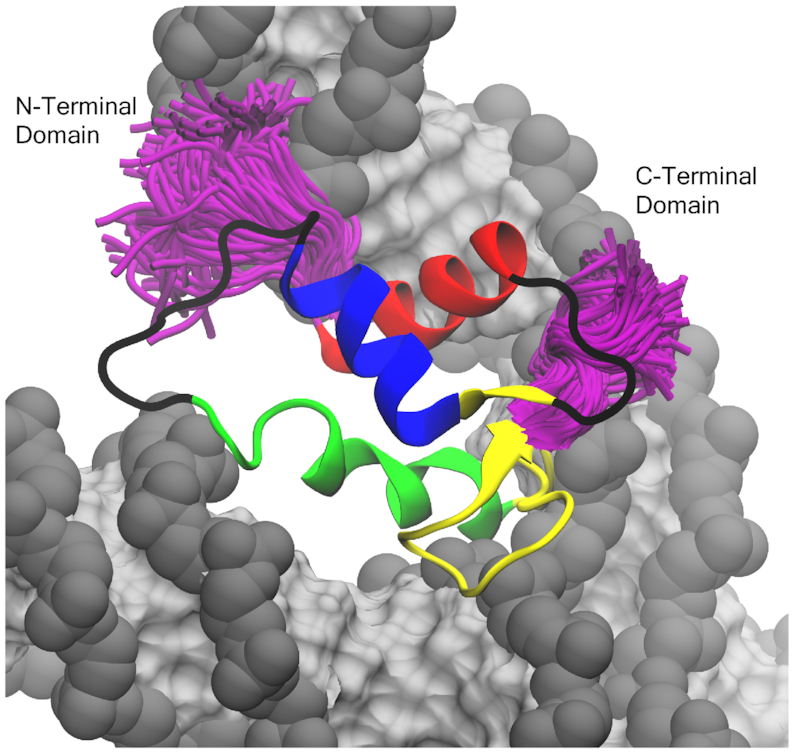
Figure 8.

Example of terminal tail sampling in the off-dyad linker histones (genGH1 shown above). Shown in purple are the sampling of the terminal tails of every 100 frames from a single simulation trajectory. Colored by secondary structure: α-helix 1 (α1; red), α-helix 2 (α2; blue), α-helix 3 (α3; green), the β-sheet (yellow), and disordered regions (black). DNA is shown in gray (backbone) and silver (bases).
