Figure 6.
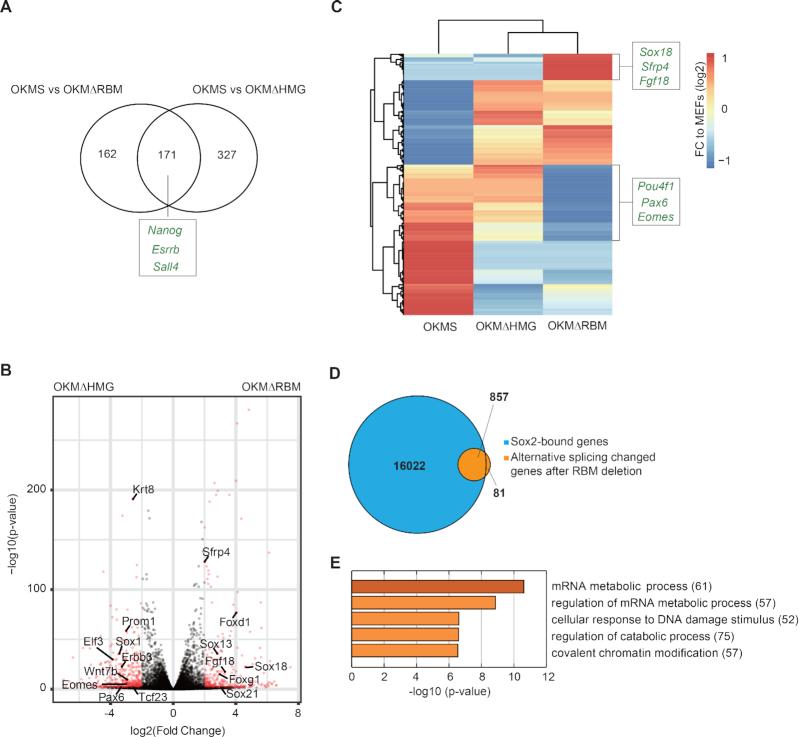
Deletion of the Sox2-RBM and Sox2-HMG have different effects on gene expression and splicing. (A) The Venn diagram compares gene sets differentially upregulated (determined with DESeq2 (38)) in OKMS versus OKMΔRBM with OKMS and OKMΔHMG. Examples of genes related to pluripotency that are depleted in both Sox2 deletion mutants compared to the OSKM control are marked. (B) Volcano plot highlighting differentially expressed genes determined with DESeq2 from OKMΔRBM and OKMΔHMG RNA-seq data. Genes at –log10(P-value) > 2 and absolute log2(fold change) value >0.5 are in red. Representative genes related to differentiation in OKMΔRBM are labelled on the right. (C) Differentially expressed genes upon OKSM, OKMΔHMG and OKMΔRBM are shown. The names of representative genes related to differentiation are depicted. (D) 938 transcripts were detected to undergo alternative splicing under Sox2-ΔRBM compared to Sox2 control conditions at day 12 of iPSC generation using rMATS (33). The Venn diagram shows the overlap genes bound by Sox2 (blue) at early reprogramming stages (35) and genes affected by alternative splicing after RBM deletion (orange). (E) The top five GO terms provided by metascape (http://www.metascape.org) of 857 genes shown in (D). The number of genes in each GO term is labelled in brackets.

