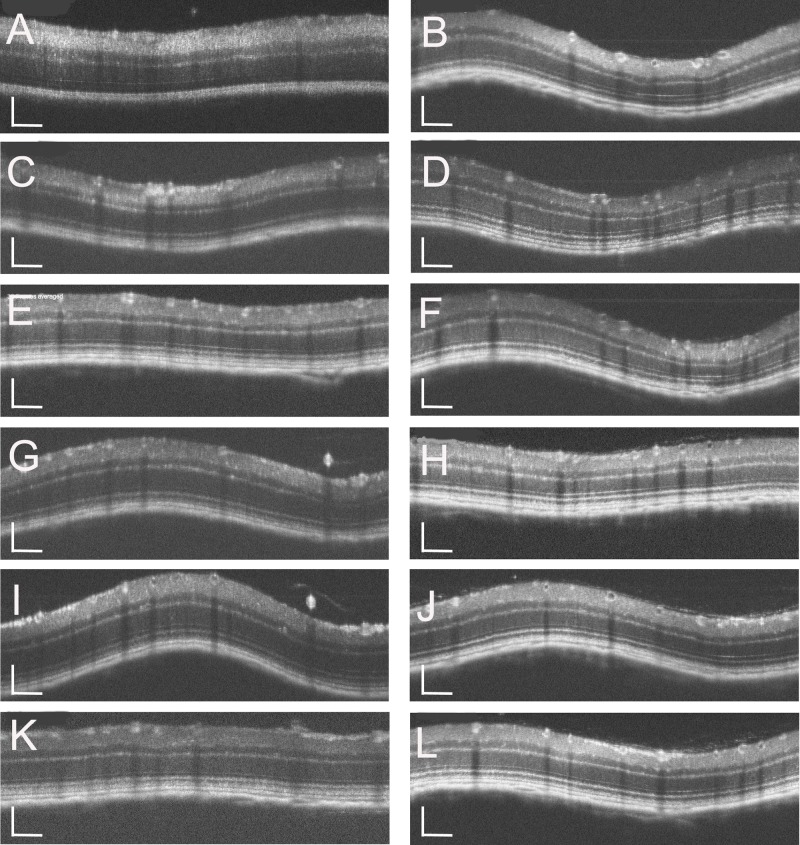
Fig 2. Representative OCT images of the C57BL/6J (A, C, E, G, I, and K) and Rdh5-/- (B, D, F, H, J, and I) mice.
Panels A, C, E, G, I, and K correspond to PM1, PM2, PM3, PM4, PM5, and PM6 of C57BL/6J mice, respectively. Panels B, D, F, H, J, and L correspond to PM1, PM2, PM3, PM4, PM5, and PM6 of Rdh5-/- mice, respectively. The position of the retinal SD-OCT image was set circumferentially around the optic disc (360°; diameter, 500 μm; 140 μm away from the optic disc margin, indicated by circles in Fig 1). The wavelike features in some images were artificially created depended on the angle of the mouse eye against the eye lens. The SD-OCT images were created using light stimulation at 830 nm. Bar indicates 100μm.

