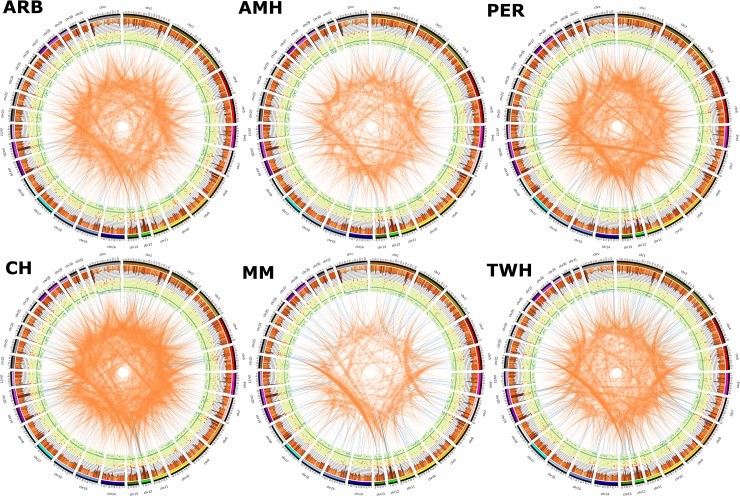
Fig 1. Circos plot summarizing the genetic variants detected in each horse.
The pattern of variation across the genomes of the six horses reveals structurally diverse regions important for immunity and olfactory reception at chromosomes 12 and 20 in all six horses. From the inside out, each plot shows two endpoints of the inter- (orange) and intra- (blue) chromosomal translocations. Intrachromosomal translocations > 5 MB are in dark blue. The yellow ring shows the copy number variations (green = normal, blue = loss, red = gain). The histogram (in orange) shows the density of SNPs detected using 1MB windows.

