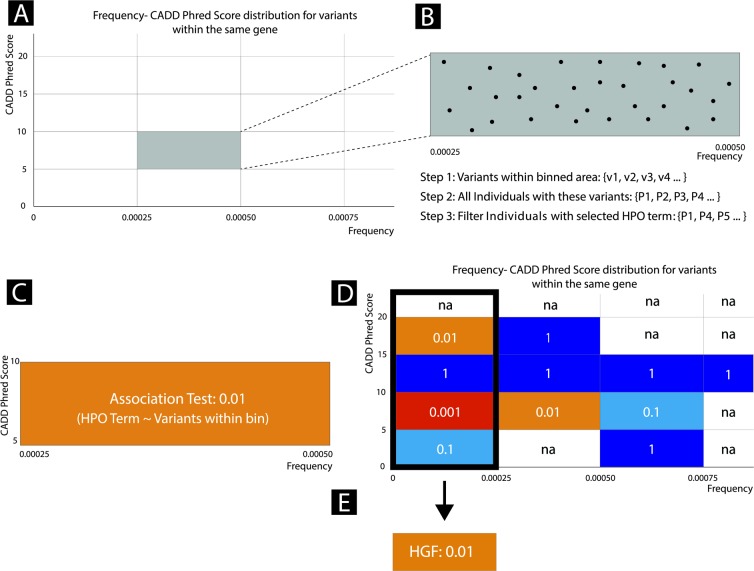
Fig 1. Phenogenon profiling workflow.
A) The distribution of frequency vs CADD Phred score for variants of a single gene were binned according to empirically chosen cut-offs. B) Variants within each binned area are further analysed. Individuals carrying these variants are identified and then filtered on the basis of whether they have a selected HPO term. C) Fisher’s Exact test is then used to determine the significance of the gene-phenotype relationship. D) A Phenogenon heatmap is produced using the Fisher Exact P-Values for each binned area. E) Fisher Exact Scores for each of the binned area in the first column are collapsed into a single HPO goodness of fit score (HGF) using a Scaled Stouffer transformation.

