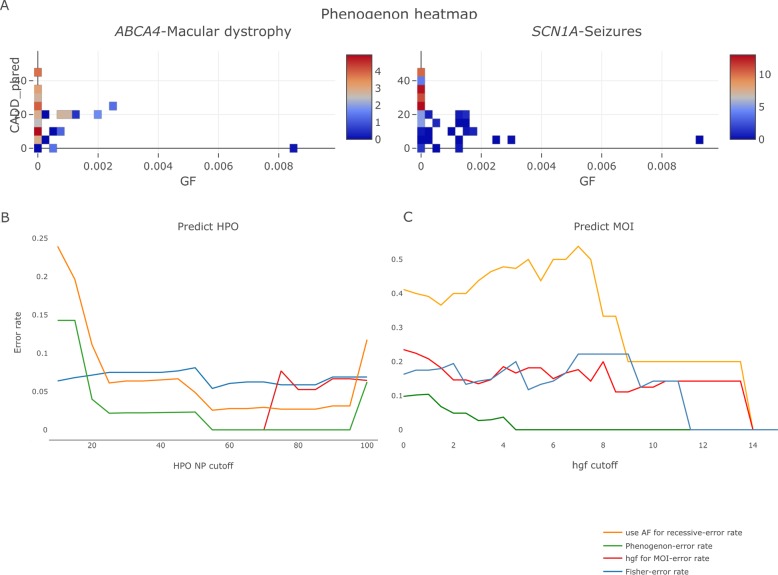
Fig 2. Using phenogenon to predict gene-HPO-mode of inheritance (MOI) relationships for the 12 known genes.
A. Examples of using Phenogenon to profile known relationships: ABCA4—Macular dystrophy (HP:0007754) -recessive, and SCN1A—Seizures (HP:0001250)—dominant. The color scales represent the HGF score. The majority of high-scoring bins are for rare variants (HGF < 0.00025). B. Error rate in predicting HPO when number of patients selected per gene is higher than ‘HPO NP cut-off’. The lines give the trend of error rates for each prediction model. C. Error rate for MOI when HPO selected per gene is higher than HGF cut-off. The lines give the trend of error rates for each prediction model. Orange line: model using gnomAD allele frequency instead of estimated homozygote frequency for recessive MOI; Red line: model using HGF for both HPO association and MOI prediction; Blue line: model using Fisher method to combine p values; Green line: our current model for Phenogenon.

