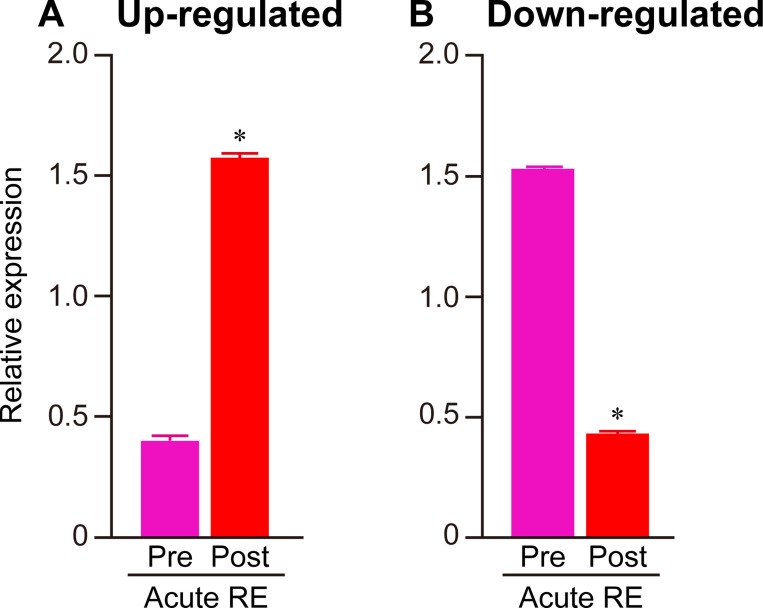
Fig 2. Responses of gene expressions to acute RE.
Quantitative analysis of 153 up-regulated (A) and 29 down-regulated (B) genes before (Pre) and after (Post) acute RE. FPKM values obtained from RNA-seq were used to calculate the mean expression levels in both groups. To normalize the differences in the distribution of data among the genes, the median value was calculated within each gene and expressed as 1. Mean ± SE. *: p < 0.05 vs. respective pre group, examined by paired t-test.

