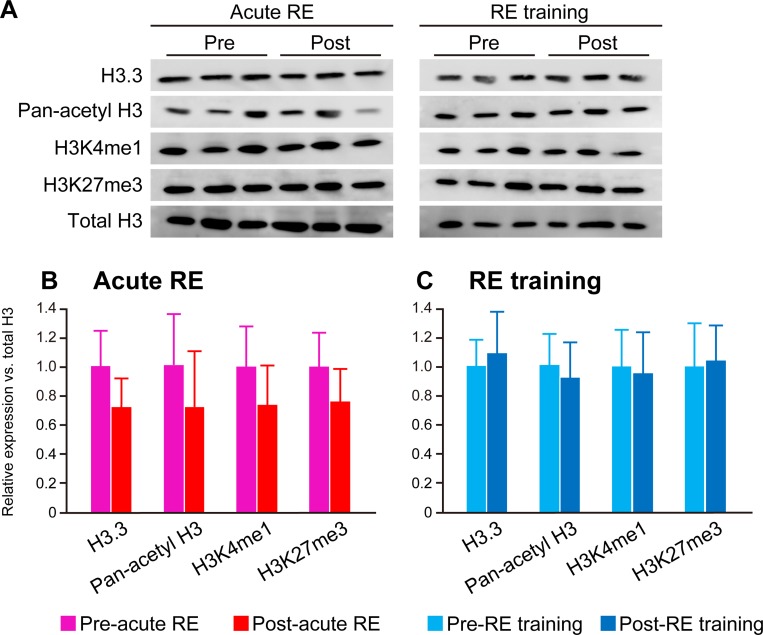
Fig 8. Effects of acute RE and RE training on protein expressions.
A: Typical band images of histones obtained in western blotting. Same samples used in Figs 6 and 7 were analyzed. B and C: Quantitative analysis of band intensities in Experiment 1 (acute RE) (B) and 2 (RE training) (C). The values were normalized into the mean level of respective pre group was 1.

