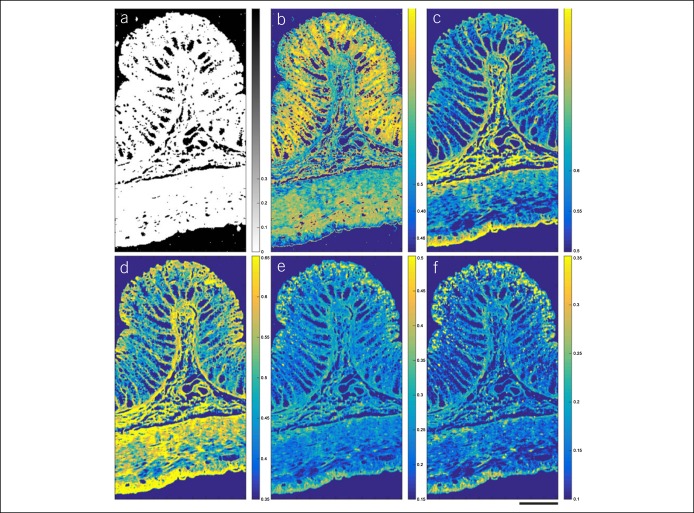
Figure 5.
Maps of Raman spectral similarity in paraffin-fixed colonic tissue. Intensity indicates the similarity with the reference spectra of molecules anticipated to be present, including (a) background mask, (b) DNA, (c) collagen, (d) muscle acetone powder, (e) phosphatidylcholine, and (f) paraffin wax. Scale line is 200 μm.

