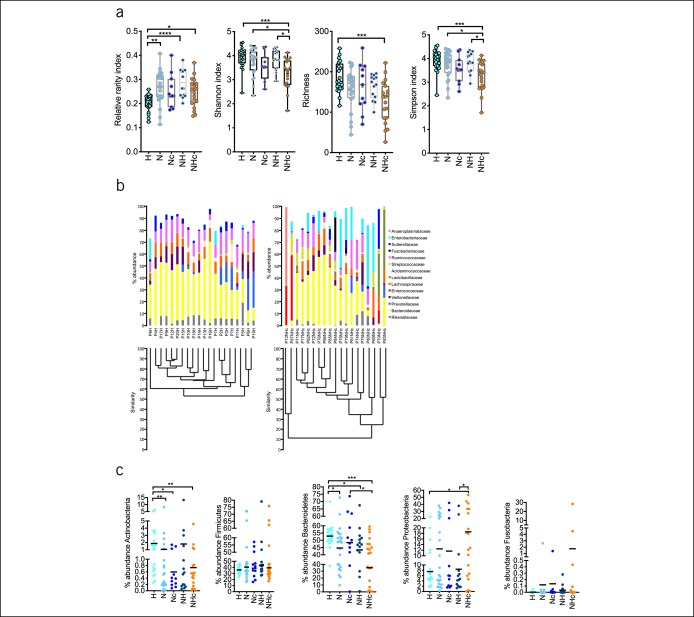
Figure 3.
Differences in diversity of bacterial communities in healthy vs NHc patients with distinctive changes on the phylum level. Phylotype richness, Shannon, and Simpson indexes diminished between groups, whereas the relative rarity index increased in N, NH, and NHc as compared to H and shown as median with range (a). Comparing healthy individuals and patients (e.g., here, the NHc group) the bacterial community was more homogenous in samples of healthy while NHc showed more diverse bacterial community. Stacked bar plot shows the means in microbial changes of abundances on the family level in H and NHc (b). Abundance of Bacteroidetes and Actinobacteria showed decrease from H to NHc, whereas abundances of Firmicutes and Proteobacteria did not reveal differences between the groups (c). Relative abundance of Fusobacteria was increased in N, Nc, NH, and NHc because of high abundances in single patients within these groups. Data are represented as median and plotting the individual patients in the graph. *P < 0.05, **P < 0.01, ***P < 0.001, ****P < 0.0001.

