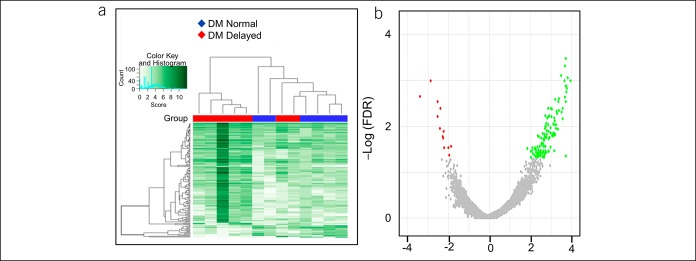
Figure 1.
Differential binding of H3K27ac between DM patients with delayed and normal GE. The affinity heat map (a) shows 140 individual sites (rows) that are differentially bound with H3K27ac between patients with normal and delayed GE. The inset shows the color scale for the binding affinity. Observe that the samples from patients with DM with delayed and normal GE are clustered separately. In the volcano plot (b), only a small fraction of all peaks are differentially bound with H3K27ac between patients with DM with delayed and normal GE. Red and green symbols represent significant differentially bound peaks (FDR < 0.05) in which the log2 (Fold change) was negative and positive in patients with delayed vs normal GE, respectively. Gray symbols represent nonsignificant differential peaks. DM, diabetes mellitus; FDR, false discovery rate; GE, gastric emptying.

