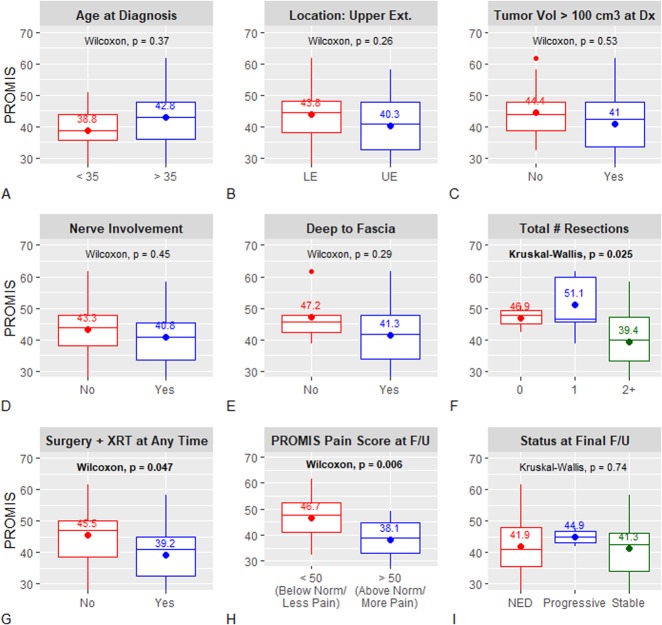
Fig. 5A-I.
PROMIS function outcomes data according to patient- and treatment-specific variables are demonstrated here; by-group mean scores are noted in each sub-plot. LE = lower extremity; UE = upper extremity; Vol = volume; Dx = diagnosis; # = number; XRT = radiation therapy; F/U = final follow-up; NED = no evidence of disease.

