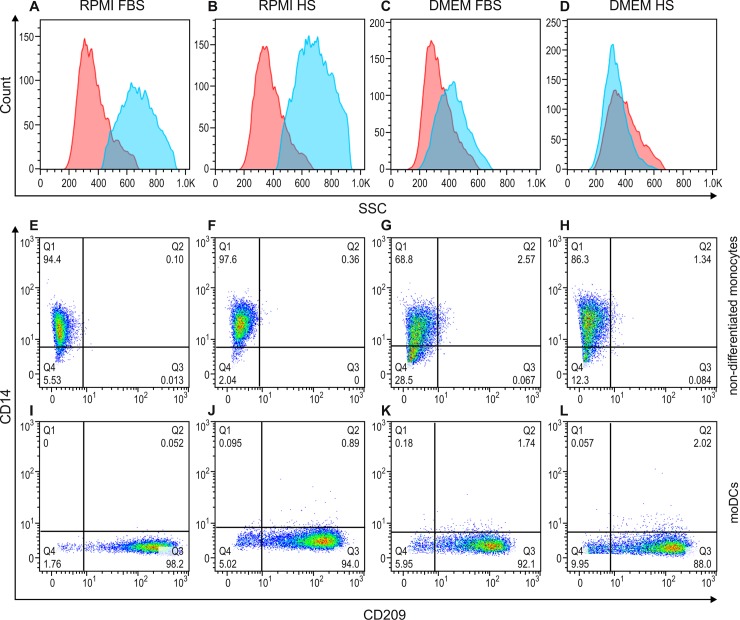
Fig 3.
Flow cytometry overlay histograms for side scatter (A-D) and dot plots for CD14 and CD209 staining (E-L) demonstrating typical cell profiles from a representative experiment out of three. Side scatter (SSC, granularity) in non-differentiated monocytes (red shaded histogram) and differentiated moDCs (blue shaded histogram) cultured in either RPMI (A and B) or DMEM medium (C and D), supplemented with either FBS (A and C) or HS (B and D). CD14 and CD209 surface marker expression on non-differentiated monocytes (E-H) and moDCs (I-L) cultured in either RPMI (E, F, I and J) or DMEM medium (G, H, K and L), supplemented with either FBS (E, G, I and K) or HS (F, H, J and L). Cells were stained with CD14-FITC (y-axis) and CD209-PE (x-axis). The percentages of cells are indicated in each quadrant.

