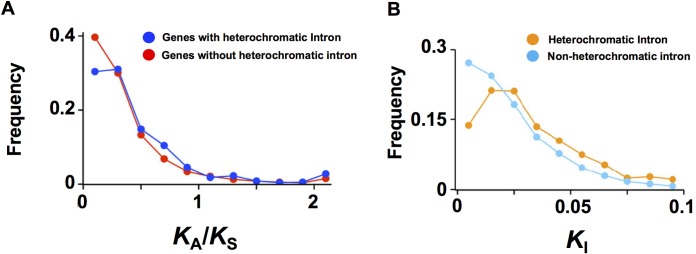
Fig 6. Patterns of nucleotide substitution rates between Oryza sativa and Oryza meridionalis.
(A) Frequency distributions of KA/KS values. Blue and red plots represent genes with and without heterochromatic introns, respectively. (B) Frequency distributions of KI values. Orange and light blue plots represent heterochromatic introns and heterochromatin-free introns, respectively.

