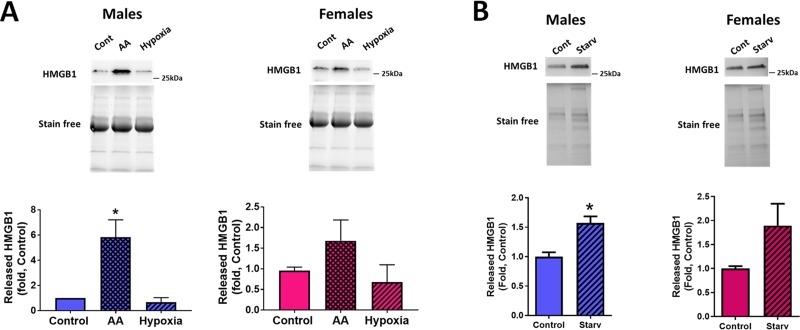
Fig 7. Sex difference in HMGB1 release in stressed MLEC and HPAEC.
HMGB1 released into conditioned media was measured by WB analysis. A–HMGB1 signal in male and female MLEC exposed to hypoxia or AA as described above. B–HMGB1 in media collected from Control and starved male and female HPAEC. Values are means ± SEM. N = 4 repetitions for MLEC (5–7 mice isolated for each sex). *p < 0.05 versus Control MLEC. Statistical analysis was performed using one way ANOVA (Turkey’s multiple comparisons test). N = 6 repetitions for HPAEC. *p < 0.05 versus Control HPAEC. Statistical analysis was performed using the unpaired t-test.

