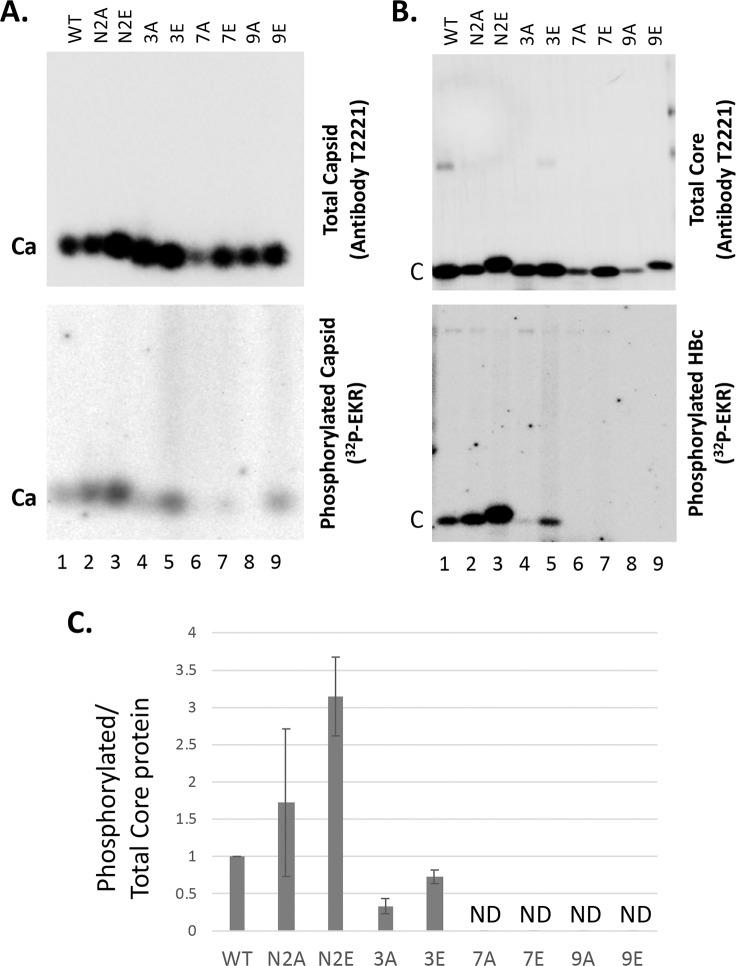
Fig 6. EKR using WT and mutant HBV capsids.
The WT and mutant HBc expression constructs were transfected into HEK293T cells. In addition to the N2A and N2E mutants above, additional HBc mutants tested here included 3A/3E (with three major CTD sites of phosphorylation—all SP motifs—changed to A or E) [30], 7A/7E (with all seven CTD sites of phosphorylation changed to A or E), and 9A/9E (with all seven CTD sites as well as the two putative NTD-S44/S49 sites changed to A or E). Cytoplasmic lysate was prepared from the transfected cells using 1% NP-40 five days after transfection. The lysate was treated with 0.5 ug/ul proteinase K at 37°C for one hr before EKR in the presence of [γ-32P]ATP. The reaction products were resolved on the native agarose gel (A) or by SDS-PAGE (B). Total capsid (A) or total core protein (B) levels were measured by chemiluminescence western blot assay using the HBc antibody T2221 (top). Radiolabeled (phosphorylated) capsid or core protein levels resulting from the EKR were measured using phosphorimaging (bottom). Ca, capsids; C, HBc protein (subunit). C. Phosphorylation efficiency during EKR was determined by normalizing the levels of labeled core protein to total core protein from B, with that from the WT capsid set to 1.0. ND, not detectable.

