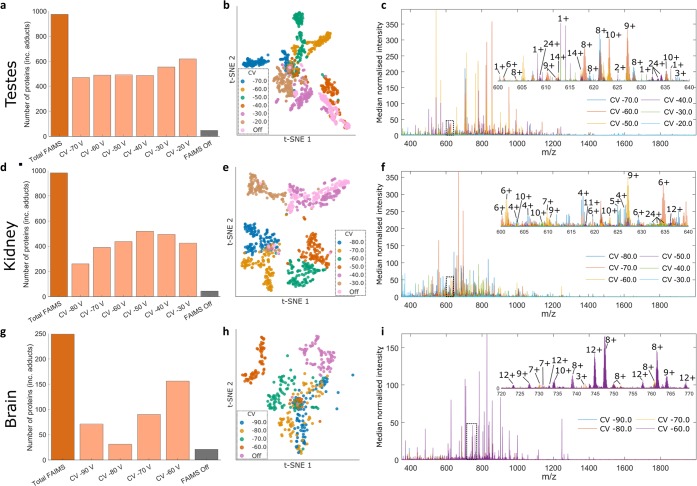
Figure 1.
LESA FAIMS MSI of thin tissue sections from testes, kidney, and brain. (A), (D), (G) Distribution of protein masses across CV values. (B), (E), (H) t-SNE plot of LESA FAIMS MSI data. Each point corresponds to a pixel at a particular CV value. (C), (F), (I) Overlay of the mass spectra obtained at the different CV values for pixel 59 (testes), pixel 70 (kidney), and pixel 35 (brain).

