Figure 2.
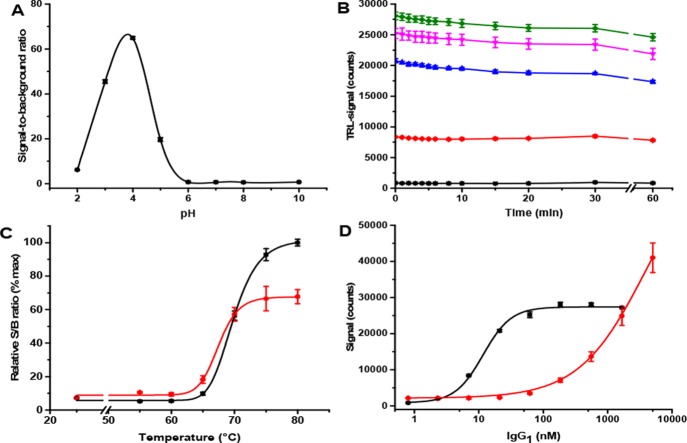
Functionality of the Protein-Probe thermal stability assay. A) Eu-probe (1 nM) response to 80 nM IgG1 was monitored at various pH by comparing signals obtained at room temperature (RT) and 80 °C. At RT, the Eu-probe does not bind to IgG1 leading to the low TRL-signal, whereas at 80 °C, the high TRL-signal was monitored. The highest S/B ratio (80 °C/RT) was obtained at pH 4. B) TRL-signals at RT were stable over the 60 min time period when monitored without (black) or with 7 (red), 21 (blue), 62 (magenta), and 128 nM (green) of IgG1. C) Temperature melting curves for IgG1 were measured up to 80 °C with Protein-Probe (black, 80 nM IgG1) and SYPRO Orange (red, 2 μM IgG1). The calculated Tm values were essentially equal between these two methods. D) Based on the IgG1 titration (0–5 μM), 50-fold improved sensitivity was calculated with the Protein-Probe (black) compared to SYPRO Orange (red) at 80 °C, as calculated from the S/B ratio of 3. Data represent mean ± SD (n = 3).

