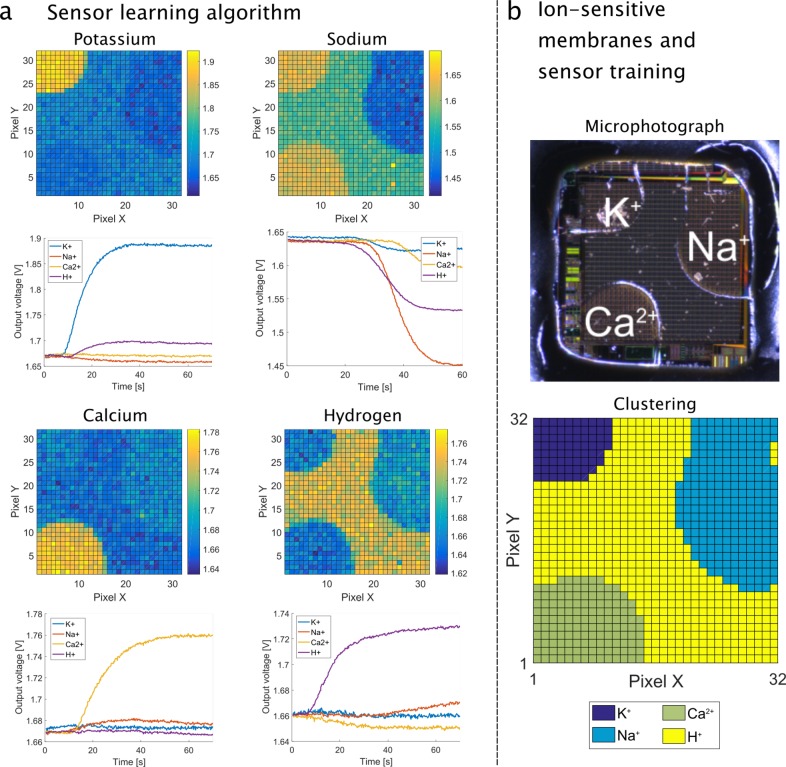
Figure 3.
(a) The calibration of the sensors is performed by inducing a decade change in single-ion concentration (K+, Na+, Ca2+, and H+). For each ion, the top figure shows the 2D image of the array at the end of each run and the bottom figure shows the temporal output curves for each membrane as the solution is flowed in the chamber. (b) Top: Photograph of a chip under the microscope to show the location of each membrane. Bottom: Chip mapping as obtained after calibration by the clustering algorithm.

