Figure 1.

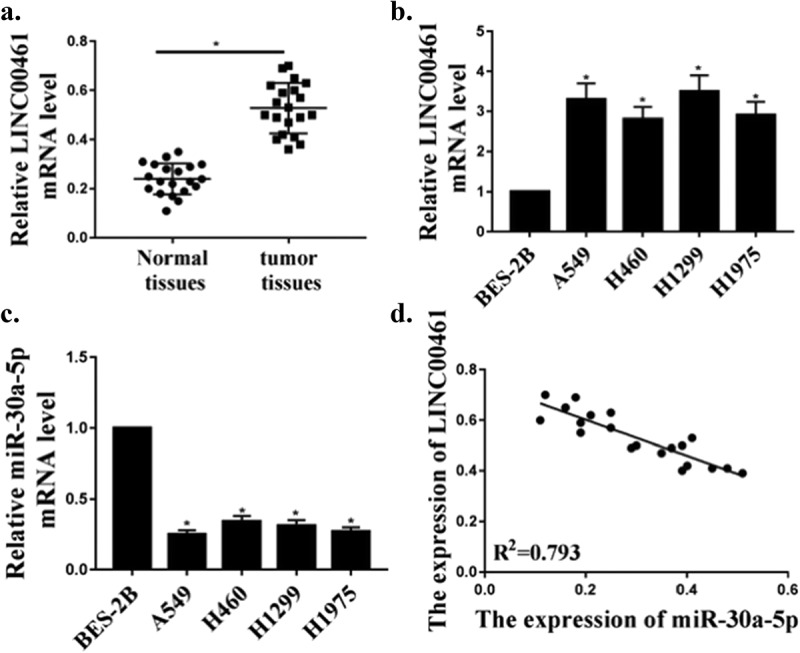
Up-regulation of LINC00461 expression and down-regulation of miR-30a-5p expression in NSCLC. (a) The levels of LINC00461 in adjacent normal tissues and NSCLC tissues (n = 20). (b) The levels of LINC00461 in human NSCLC cell lines and normal cells. (c) The levels of miR-30a-5p in normal cells and human NSCLC cell lines. (d) Correlation between LINC00461 and miR-30a-5p levels.* P < 0.05, n = 3.
