Figure 4.

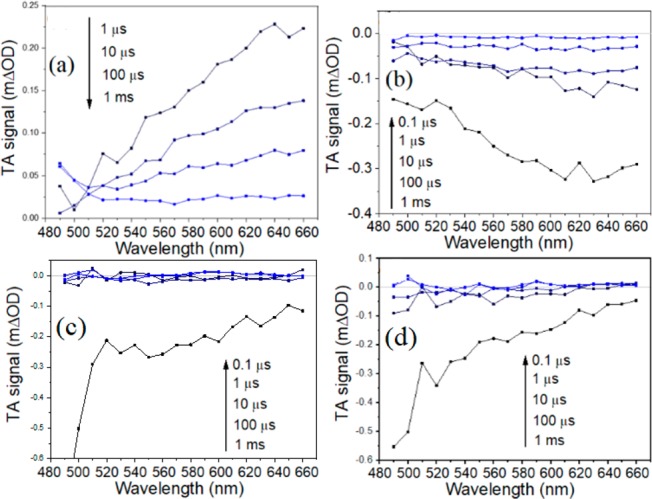
TAS spectra, obtained in N2 atmosphere after 355 nm excitation (200 Hz, 850 μJ/cm2/pulse), of (a) ref-g-C3N4 sample, (b) def-g-C3N4-1 sample, (c) def-g-C3N4-2 sample, and (d) def-g-C3N4-5 sample.

TAS spectra, obtained in N2 atmosphere after 355 nm excitation (200 Hz, 850 μJ/cm2/pulse), of (a) ref-g-C3N4 sample, (b) def-g-C3N4-1 sample, (c) def-g-C3N4-2 sample, and (d) def-g-C3N4-5 sample.