Figure 6.

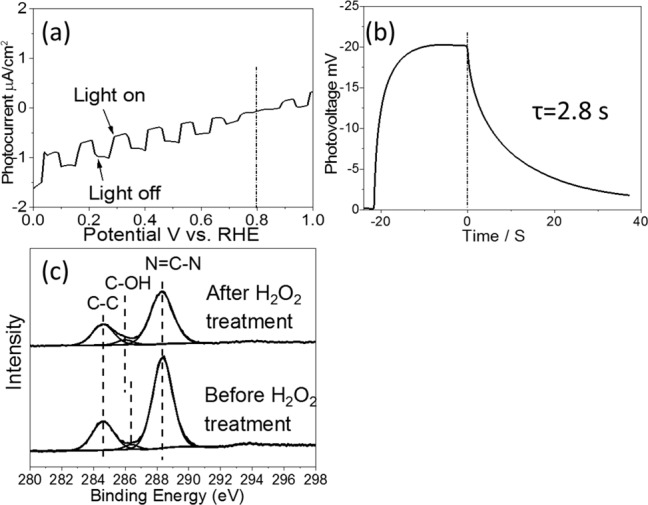
(a) Photocurrent versus potential plot, (b) open circuit photovoltage decay curve, and (c) C1s XPS spectra of ref-g-C3N4 before and after H2O2 treatment.

(a) Photocurrent versus potential plot, (b) open circuit photovoltage decay curve, and (c) C1s XPS spectra of ref-g-C3N4 before and after H2O2 treatment.