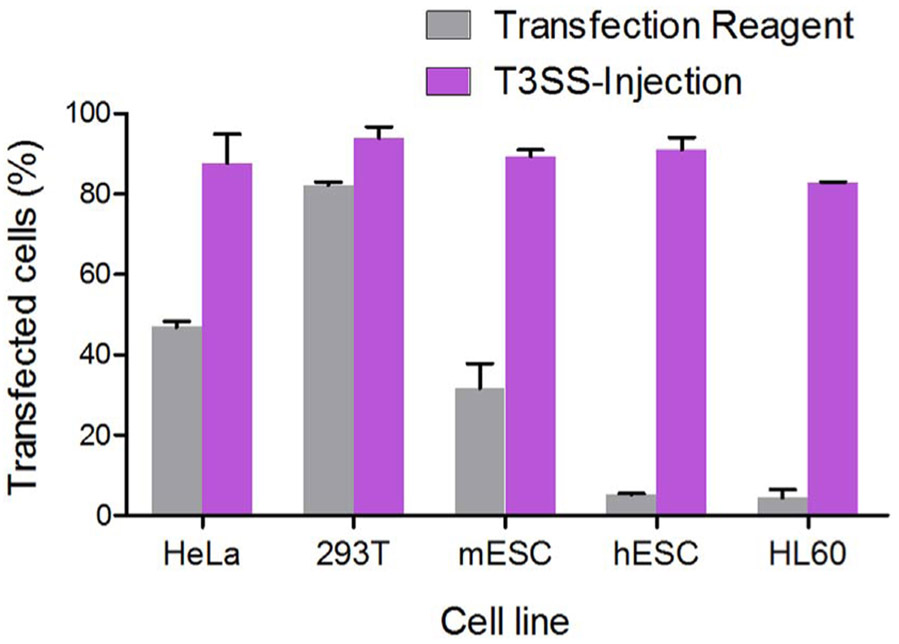
Fig. 5.
Efficiency comparison of transfection and T3SS-mediated protein delivery. For transfection, different cells were transfected with plasmid (pFLAG-CMV2-iExoS) encoding the FLAG-tagged inactive ExoS (E381A, iExoS for short) by a commercially available transfection reagent. For T3SS-injection, cells were infected by attenuated P. aeruginosa Δ8 expressing FLAG-iExoS fusion. The number of transfected cells was assessed 24 h posttransfection (grey bars) or 4 h post-injection (purple bars) by labeling the cells with anti-FLAG antibody and then flow cytometric analysis. Error bars represent standard deviation of triplicate FACS assays. (For interpretation of the references to colour in this figure legend, the reader is referred to the web version of this article.)

