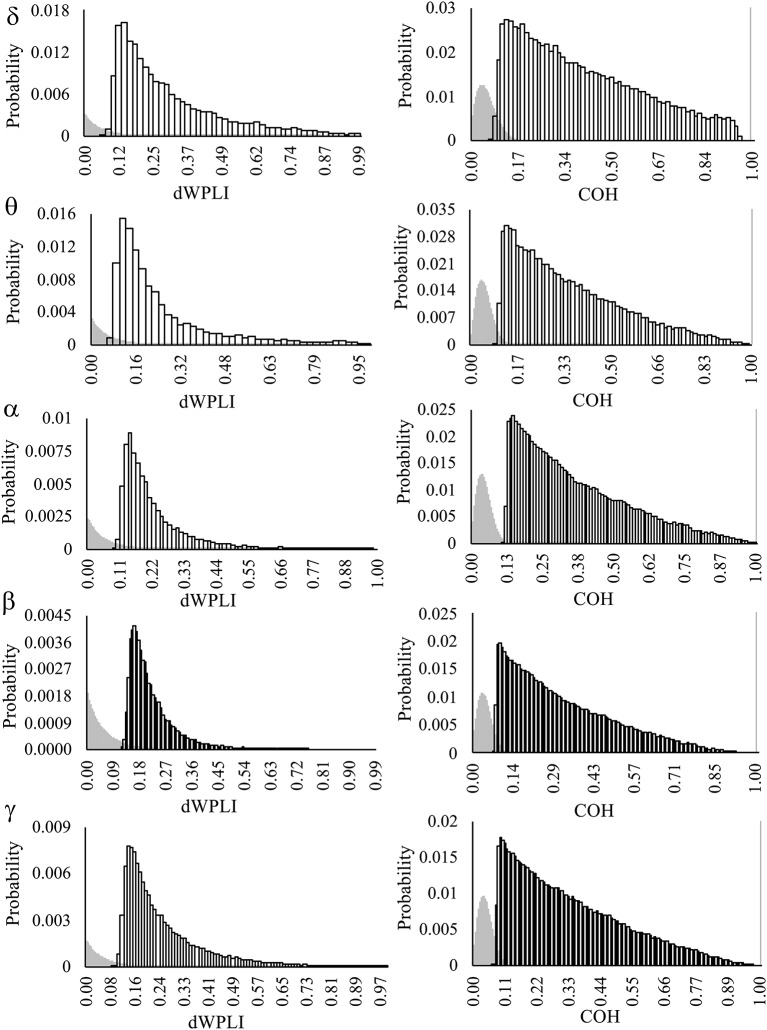
Figure 2.
The probability distributions of connection weights (dWPLI, COH) from null distributions (gray) and observed distributions (white boxes). Observed distributions are comprised of FC greater than the top 5% of re-shuffled, surrogate data. Note the bimodal distribution of surrogate data from COH FC, which are most likely to exhibit near perfect coherence (>0.99; gray bar on the far right). Frequency bands: delta (δ = 1–4 Hz), theta (θ = 4.5–7 Hz), alpha (α = 7.5–15 Hz), beta (β = 15.5–30 Hz), and low gamma (γ = 30.5–50 Hz).

