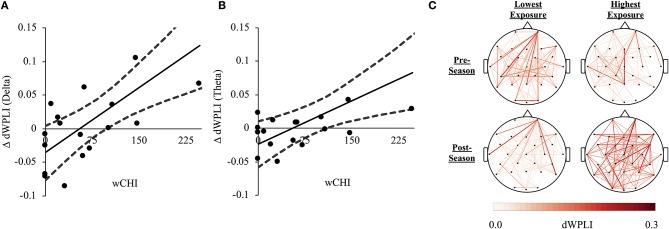
Figure 3.
(A) A direct relationship between wCHI and change in FC (ΔdWPLI) from pre-season to post-season measured in the delta frequency band (1–4 Hz). Athletes sustaining the greatest wCHI exhibited the greatest increases in delta band dWPLI. (B) A direct relationship between wCHI and ΔdWPLI measured in the theta frequency band (4.5–7 Hz). Athletes sustaining the greatest wCHI exhibited the greatest increases in theta band dWPLI. (C) Network edges formed by slow-rhythm (1–7 Hz) dWPLI were averaged across athletes in the lowest (Athletes 13–18; left column) and the highest tertile of wCHI (Athletes 1–6; right column), at pre-season (top row) and post-season (bottom row). The nodes (channels) are oriented such that the front of the head is at the top of the figure. The colorbar represents dWPLI (0.00-0.30). For illustrative purposes, each graph was thresholded to only show the strongest 30% of all group-averaged FC. The athletes sustaining the most wCHI exhibited increased connectivity in the slow-rhythm, whole-brain network relative to athletes sustaining no (or very little) wCHI.

