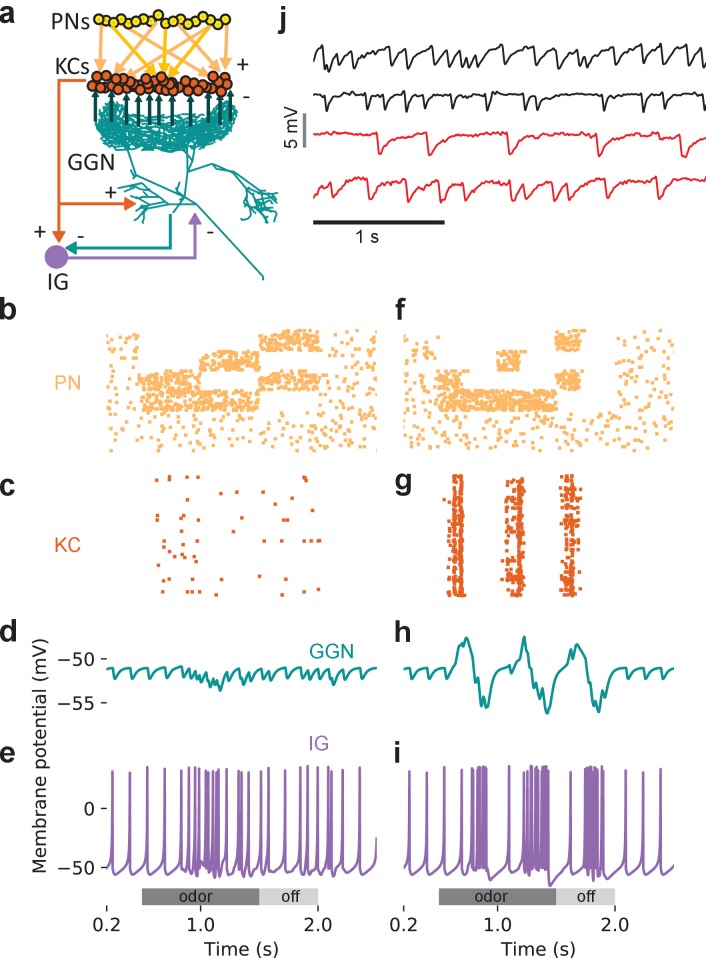
Figure 9. An additional, unidentified olfactory pathway to IG is needed to explain odor-elicited hyperpolarization in GGN.
(a) Schematic of model with IG receiving direct excitation from KCs and reciprocal inhibition from GGN. (b) Spike raster of PN activity producing GGN hyperpolarization. (c) Spike raster of KC population activity in the same simulation. (d) Simulated GGN membrane potential including odor-elicited hyperpolarization mimics responses observed in vivo (e.g. Figure 4, Animal 3, hexanal). (e) Corresponding simulated IG membrane potential. This simulation included a 200 ms synaptic delay from KCs to IG. (f–i) Varying the temporal pattern of PN population activity can produce different response pattern in the same network as e. (f) Raster plot of PN activity with a different temporal pattern from that in e. (g) Spike raster showing concomitant KC activity. (h) Simulated GGN membrane potential including odor evoked de- and hyperpolarization (similar to Figure 4, Animal one hexanal). (i) Corresponding simulated IG membrane potential. (j) Spontaneous activity in IG does not originate in the antennal lobe. Top two black traces show spontaneous IPSPs in GGN’s membrane voltage from two animals with intact olfactory systems. The bottom two red traces are from the left and the right GGN in another animal in which the antennal lobes had been silenced by cutting both antennal nerves. Vertical scale bar 5 mV, horizontal scale bar 1 s.

