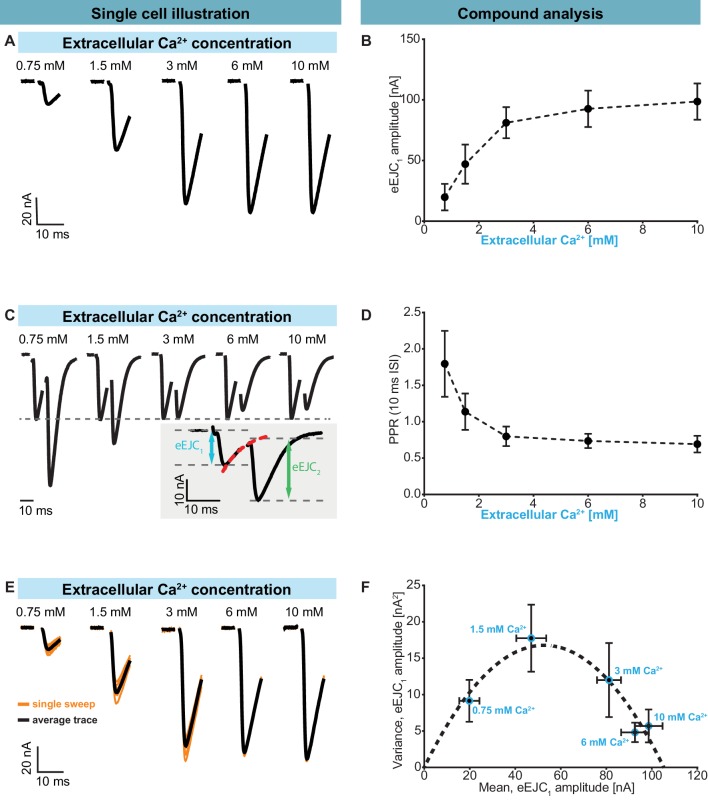
Figure 2. Characterization of short-term plasticity at the Drosophila melanogaster NMJ.
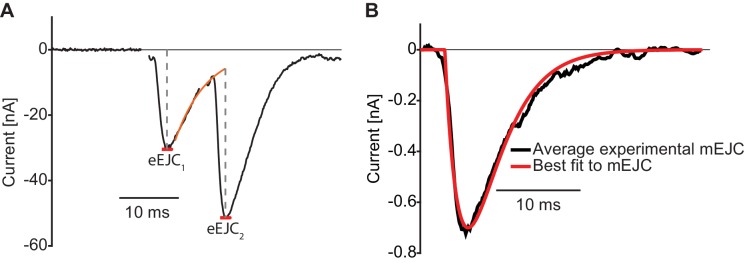
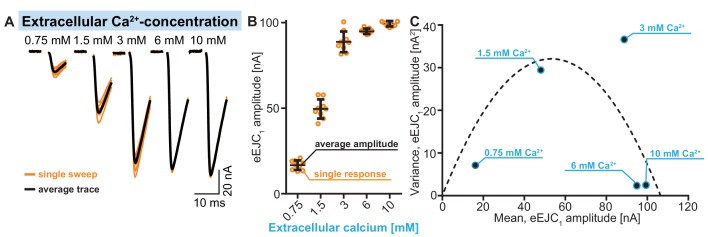
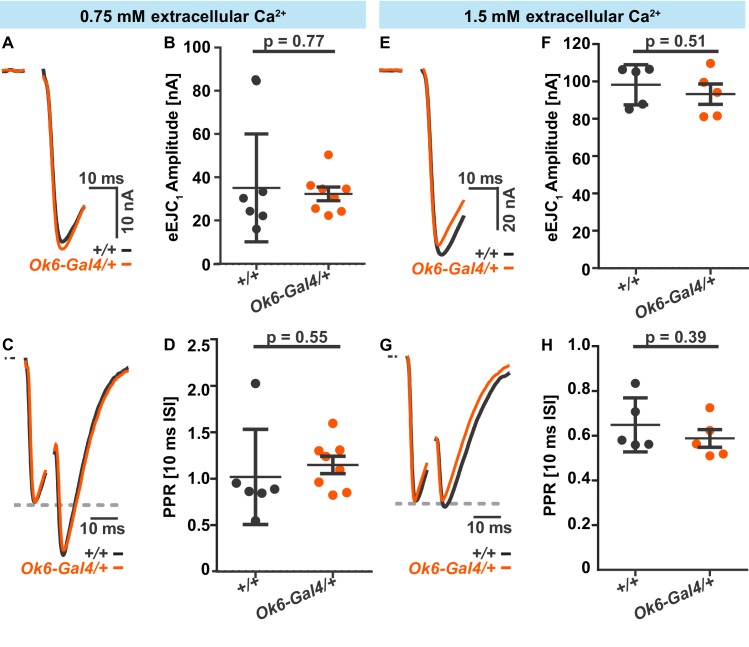
Two-electrode voltage clamp recordings of AP-evoked synaptic transmission in muscle 6 NMJs (genotype: Ok6-GAL4/+ (Ok6-Gal4/II crossed to w[1118])). Left panel (A, C, E) shows example traces from one cell. Right panel (B, D, F) shows quantification across cells. (A) Representative eEJC traces from a single cell measured at different Ca2+ concentrations (0.75–10 mM). (B) Average eEJC1 amplitudes and SD from six animals as a function of extracellular Ca2+ concentration. (C) Representative eEJC traces of paired pulse paradigm (10 ms inter-stimulus interval, normalized to eEJC1) from single cell measured at different Ca2+ concentrations (0.75–10 mM). While STF can be seen at the two lowest extracellular Ca2+ concentrations (0.75 and 1.5 mM), the cell exhibits STD for extracellular Ca2+ concentrations of 3 mM or more. Insert (gray background) shows calculation of eEJC2. An exponential function was fitted to the decay to estimate the baseline for the second response (see Figure 1—figure supplement 1 and Materials and methods for details). (D) Mean and SD of PPR values (6 cells from six animals) at different Ca2+ concentrations. (E) Experiment to assess variance of repeated synaptic responses in a single cell. eEJC1 traces in response to nine consecutive AP stimulations (10 s interval) are shown (orange lines) together with the mean eEJC1 response (black line) at different extracellular Ca2+ concentrations (0.75–10 mM, see Materials and methods). (F) Plot of mean eEJC1 variance as a function of the mean eEJC1 amplitude across 6 cells from six animals for each indicated Ca2+ concentration. The curve shows best fitted parabola with intercept forced at (0,0) (Var = −0.0061*<eEJC1>2+0.6375 nA*<eEJC1>, corresponding to nsites = 164 and q = 0.64 nA when assuming a classical binomial model (Clements and Silver, 2000), see Materials and methods). For the variance-mean relationship of the single cell depicted in Figure 2E , please refer to Figure 2—figure supplement 2. Experiments were performed in Ok6-Gal4/+ 3rd instar larvae, often used as a control genotype for experiments using cell-specific driver lines. Separate experiments were performed to ensure that this genotype showed similar synaptic responses and STP behavior as wildtype animals (Figure 2—figure supplement 3). Used genotype: Ok6-Gal4/II crossed to w[1118]. Materials and methods section ‘Fly husbandry, genotypes and handling’ lists all exact genotypes. Data points depict means, error bars are SDs across cells except in (F), where error bars show SEM. Raw data corresponding to the depicted graphs can be found in the accompanying source data file (Figure 2—source data 1). Scripts for analysis of recorded traces are found in accompanying source data zip file (Figure 2—source data 2). Raw traces from paired-pulse experiments summarized in Figure 2 and Figure 2—figure supplements 2 and 3 can be found in Figure 2—source data 2; Figure 2—figure supplement 1—source data 1; Figure 2—figure supplement 3—source data 1. Estimation of eEJC2 amplitudes and fitting of a smooth mEJC function (used in simulations, see Materials and methods) are illustrated in Figure 2—figure supplement 1.


