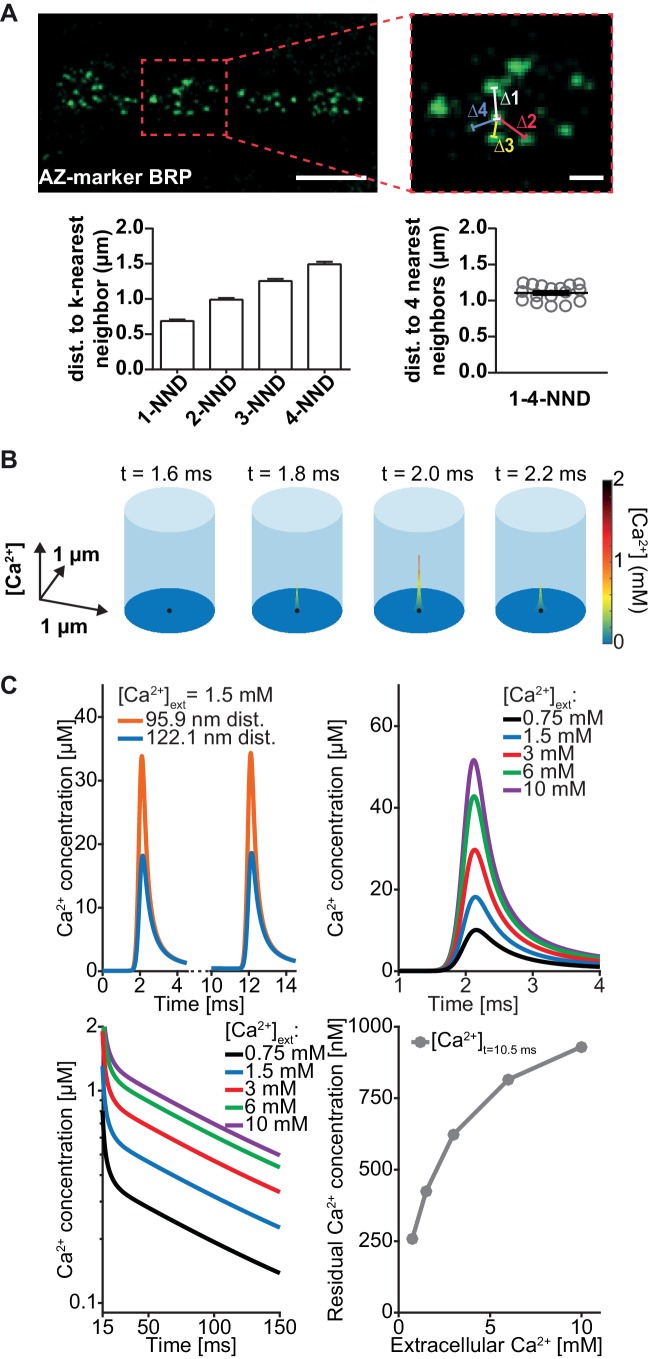
Figure 3. Simulation of AP-induced synaptic Ca2+ profiles.
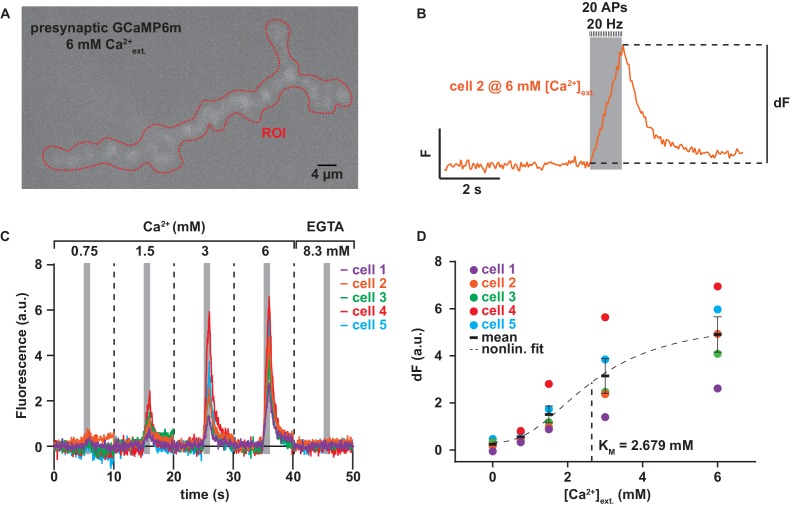
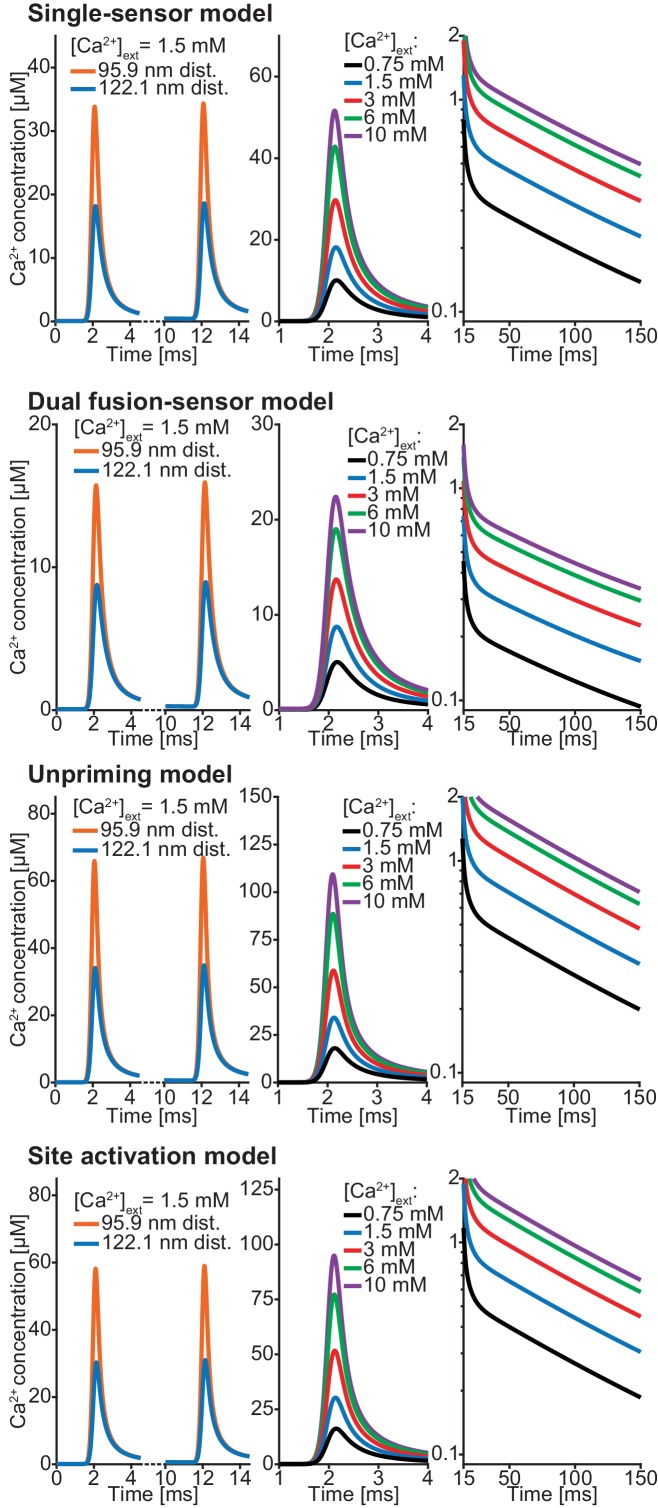
(A) Estimation of the simulation volume and Ca2+ simulations. The left hand image shows a confocal scan of a 3rd instar larval NMJ stained against the AZ marker Bruchpilot (BRP) (genotype: w[1118]; P{w[+mC]=Mhc-SynapGCaMP6f}3–5 (Bloomington Stock No. 67739). The right hand image shows a higher magnification of the indicated region. To determine the dimensions of the simulation volume, the average distance of each AZ to its closest four neighboring AZs (k-NND = kth nearest neighbor distance) was determined. The average inter-AZ distance to each of the closest four neighboring AZs (1- through 4-NND) is depicted on the left. Average and SEM of inter-AZ distances (1-4-NND) are depicted on the right. White scale bars: Left: 5 µm; right: 1 µm. (B) Example illustration of the Ca2+ simulation. The simulation volume is a cylinder whose base area (radius 624 nm) is the same as a square with side length of the mean 1–4-NND. The local Ca2+ concentration is shown at different time points following an AP-induced Gaussian Ca2+ current (the area/height is a free parameter, see Table 2, the FWHM is 0.36 ms). The simulation started at t=0 ms, Ca2+ influx was initiated at t=0.5 ms and peaked at t=2 ms. The Ca2+ (point) source is located in the AZ center (black dot) and the Ca2+ concentration is determined at 10 nm height from the plasma membrane. (C) Example simulation of the local Ca2+ concentration profile in response to stimulation with a pair of APs (current was initiated at 0.5 and 10.5 ms and peaked at 2 and 12 ms). Simulations were performed using the best fit parameters of the single sensor model described below (see Figure 4, Table 2). Top left: Ca2+ transients in response to the first AP at two distances: 95.9 nm and 122.1 nm (the mean of Rayleigh/integrated Rayleigh). Top right: AP-induced Ca2+ transient at 122.1 nm for all experimental extracellular Ca2+ concentrations. Bottom left: Semi-logarithmic plot of Ca2+ decays toward baseline after the 2nd transient (residual Ca2+) at different extracellular Ca2+ concentrations ([Ca2+]ext). Time constant of decay is τ = 111 ms. Bottom right: Residual Ca2+ levels at 122.1 nm after 10.5 ms of simulation as a function of extracellular Ca2+ concentrations. Data depicted in panel A were collected from 17 different animals. Used genotype: w[1118]; P{w[+mC]=Mhc-SynapGCaMP6f}3–5 (Bloomington Stock No. 67739, panel A). Materials and methods section ‘Fly husbandry, genotypes and handling’ lists all exact genotypes. Values used for graphs can be found in the accompanying source data file (Figure 3—source data 1). GCaMP6m experiment is summarized in Figure 3—figure supplement 1. Ca2+ signals for all optimised models (below) are summarised in Figure 3—figure supplement 2.


