. 2020 Feb 20;9:e51032. doi: 10.7554/eLife.51032

Figure 7. An unpriming model with Ca2+ dependent regulation of the RRP accounts for experimentally observed Ca2+ dependent eEJCs, STP and variances.

(A) Diagram of the unpriming model. The rate of unpriming decreases with the Ca2+ concentration. All other reactions are identical to the single-sensor model (Figure 4A). (B) Assumed basal Ca2+ concentration at different extracellular Ca2+ concentrations (red curve) together with the steady-state amount of priming (blue). Increasing basal Ca2+ concentration increases priming. (C) The average fraction of occupied release sites as a function of time in simulations with 0.75 mM (green) and 10 mM (gray) extracellular Ca2+ concentration. Release reduced the number of primed SVs. At 0.75 mM Ca2+, the Ca2+-dependent reduction of unpriming leads to ‘overfilling’ of the RRP between AP1 and AP2, thereby inducing facilitation. (D) Average experimental eEJC traces (black) together with average simulated traces (red). (E) eEJC1 amplitudes of experiment (black) and simulation (red). Error bars and colored bands show standard deviation. (F) Average, normalized eEJC traces of experiment (black) and simulation (red). (G) PPR values of experiment (gray) and simulation (blue). Error bars and colored bands show standard deviation. Simulations reproduce the experimentally observed facilitation. (H) Average simulated traces (red) and examples of different outcomes of the stochastic simulation (colors). (I) Plot of the mean synaptic variance vs. the mean eEJC1 values, both from the experiment (black) and the simulations (red). The curves show the best fitted parabolas with forced intercept at (0,0) (simulation: Var = −0.0053*<eEJC1>2+0.6090 nA*<eEJC1>, corresponding to nsites = 189 and q = 0.61 nA when assuming a classical binomial model (Clements and Silver, 2000), see Materials and methods). (J) Similar to Figure 6J. Parameter exploration of the unpriming model varying Qmax, kM,prim, and u (unpriming rate constant). Each ball represents a choice of parameters and the color indicates the PPR value. Black lines show the best fit parameters, and arrows show the experimental and best fit simulation values. (K) Same parameter choices as in (J). The colors indicate the optimal maximal number of SVs (i.e. number of release sites, nsites) in order to fit the eEJC1 amplitude at the five different Ca2+ concentrations. A large span of PPR values (shown in (J)) can be fitted with a reasonable number of release sites (shown in (K)). Experimental data (example traces and means) depicted in panels D-G,I are replotted from Figure 2A–D,F. Parameters used for simulation can be found in Tables 13. Simulation scripts can be found in Source code 1. Results from simulations (means and SDs) can be found in the accompanying source data file (Figure 7—source data 1). Simulations of the unpriming model with cooperativity two are summarized in Figure 7—figure supplement 1. The site activation model (described later) is introduced and results are summarized in Figure 7—figure supplement 3. Simulations of the unpriming model with various inter-stimulus intervals are summarized in Figure 7—figure supplement 2.

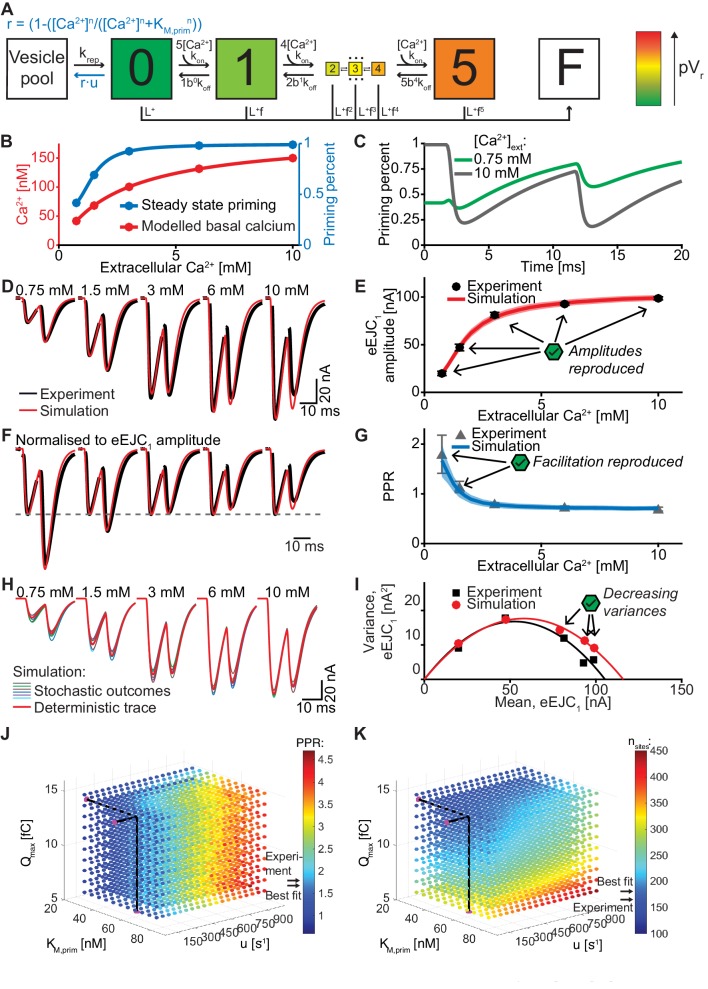
Figure 7.

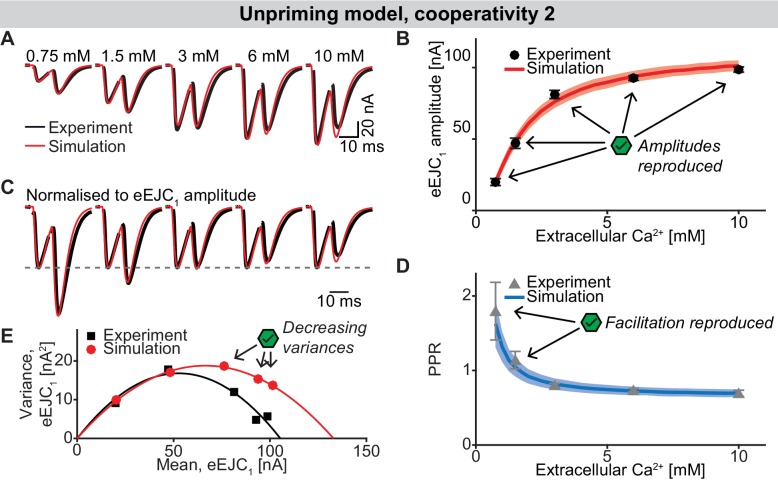
Figure 7—figure supplement 1. The unpriming model with cooperativity 2.

Figure 7—figure supplement 1.

(A) Average, experimental eEJC traces (black) together with average simulated traces (red). (B) eEJC1 amplitudes of experiment (black) and simulation (red). Error bars and colored bands show standard deviation. Like with the three models described in the main text, simulations of this model reproduce eEJC1 amplitudes well. (C) Average, normalized eEJC traces of experiment (black) and simulation (red). (D) PPR values of experiment (gray) and simulation (blue). Error bars and colored bands show standard deviation. Like the unpriming model with cooperativity 5 (Figure 7), this model reproduces the short-term facilitation observed in experiments. (E) Plot of the mean synaptic variance vs. the mean eEJC1 values, both from the experiment (black) and the simulation (red). The curves show the best fitted parabolas with forced intercept at (0,0)) (simulation: Var = −0.0042*< eEJC1>2+0.5648 nA*< eEJC1>, corresponding to nsites = 238 and q = 0.56 nA when assuming a classical binomial model (Clements and Silver, 2000), see Materials and methods). Like the unpriming model with cooperativity 5, variances decrease with increasing extracellular Ca2+ concentration, although the variances are slightly higher. Experimental data (example traces and means) depicted in panels A-E are replotted from Figure 2A–D,F. Parameter values used for simulations can be found in Tables 13. Simulation scripts can be found in Source code 1. Results from simulations (means and SDs) can be found in the accompanying source data file (Figure 7—source data 1).
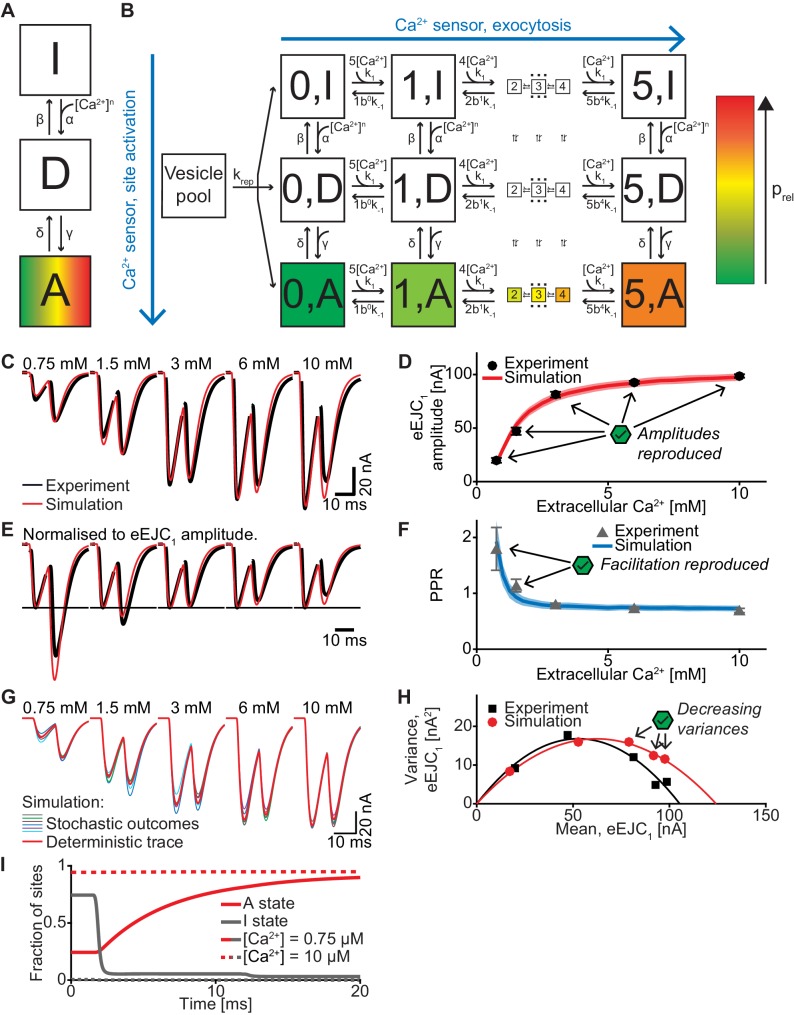
Figure 7—figure supplement 2. A model with Ca2+-dependent release site activation accounts for experimentally observed eEJCs, STP and variances.

Figure 7—figure supplement 2.

(A) Diagram of the site activation mechanism. Three states are introduced: [I], inactive, [D], delay, and [A], activated. SV fusion is only allowed from sites in state [A]. The rate from [I] to [D] is increased by Ca2+, whereas the rate from [D] to [A] is slower and independent of Ca2+, thereby introducing a delay. All (in)activation reactions are assumed to be reversible. (B) Full site activation model. The Ca2+ (un)binding of the SVs follow the same equations as in the single-sensor model and occurs independently of the site (in)activation. Replenishment is allowed into empty release sites regardless of activation status. (C) Average, experimental eEJC traces (black) together with average simulated traces (red). (D) eEJC1 amplitudes of experiment (black) and simulation (red). Error bars and colored bands show standard deviation. Like with the three models described in the main text, simulations reproduce eEJC1 amplitudes well. (E) Average, normalized eEJC traces of experiment (black) and simulation (red). (F) PPR values of experiment (gray) and simulation (blue). Error bars and colored bands show standard deviation. Like the unpriming model, simulations reproduce the experimentally observed facilitation. (G) Average simulated traces (red) and examples of different outcomes of the stochastic simulation (colors). (H) Plot of the mean synaptic variance vs. the mean eEJC1 values, both from the experiment (black) and the simulation (red). The curves show the best fitted parabolas with forced intercept at (0,0) (simulation: Var = −0.0043*< eEJC1>2+0.5398 nA*< eEJC1>, corresponding to nsites = 233 and q = 0.54 nA when assuming a classical binomial model (Clements and Silver, 2000), see Materials and methods). Like in experiments, simulations lead to decreasing variance at the highest Ca2+ concentrations. (I) The number of sites in state [I] and [A] (gray and red resp.) in simulations with extracellular Ca2+ concentrations of 0.75 mM and 10 mM (solid and dashed resp.). The varying basal Ca2+ concentration yield different initial amounts of site activation. The activation of sites mainly occurs between APs because of the delay state. Experimental data (example traces and means) depicted in panels C-F,H are replotted from Figure 2A–D, F. Parameter values used for simulations can be found in Tables 13. Simulation scripts can be found in Source code 1. Results from simulations (means and SDs) can be found in the accompanying source data file (Figure 7—source data 1).
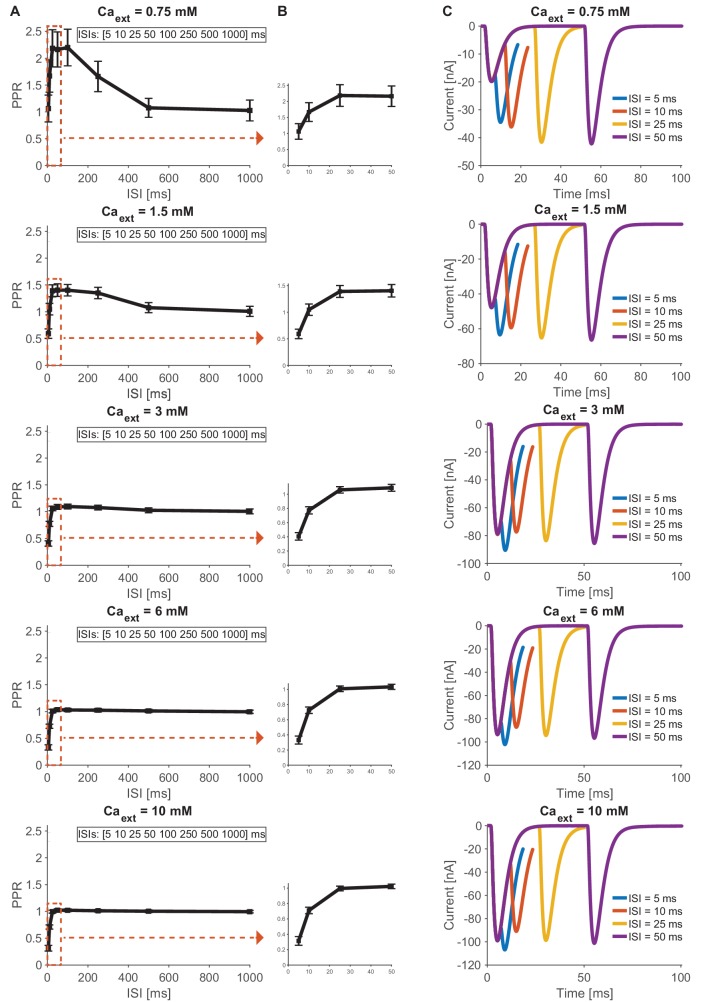
Figure 7—figure supplement 3. Simulation based time course predictions of paired-pulse STF recovery for different interstimulus intervals across different Ca2+ concentrations (0.75–10 mM).

Figure 7—figure supplement 3.

(A) Estimated PPRs for 0.75, 1.5, 3, 6 and 10 mM extracellular Ca2+ (from top to bottom) as a function of interstimulus interval (5, 10, 25, 50, 100, 250, 500 and 1000 ms). STF can be detected at low (0.75 mM) and physiological (1.5 mM) Ca2+ concentrations and decays after approximately 100 ms, no STF can be detected at high (3–10 mM) Ca2+ concentrations (starting with PPR values below 0.5 at 5 ms and increasing to PPR values around one for intervals above 25 ms). Regions of interest indicated by dashed red square are shown as a close-up in next panel. (B) Estimated paired-pulse ratio values (PPR) for Ca2+ concentrations (0.75–10 mM) 0.75, 1.5, 3, 6 and 10 mM extracellular Ca2+ (from top to bottom) as a function of their interstimulus interval (5, 10, 25, 50 ms). (C) Examples of average traces from paired-pulse simulations at different (0.75–10 mM) extracellular Ca2+ (from top to bottom) for 5 ms (blue), 10 ms (red), 25 ms (yellow) and 50 ms (purple) interstimulus intervals. Results from simulations (means and SDs) can be found in the accompanying source data file (Figure 7—source data 1).