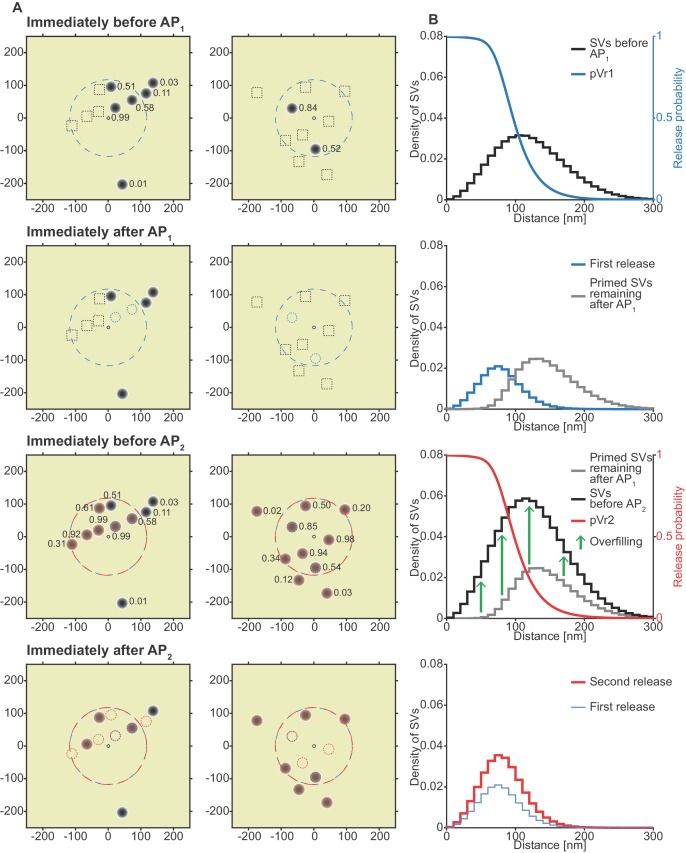
Figure 8. The unpriming model counteracts short-term depression by increasing the number of responsive SVs between stimuli and predicts a more efficient use of SVs throughout the synapse.
(A) Two examples of docked SVs stochastically placed according to the distribution described in Figure 1D and their behavior in the PPR simulation at 0.75 mM extracellular Ca2+ concentration. For clarity, 10 SVs are shown per AZ and only a central part of the AZ is shown. Top row: Prior to AP1, only some release sites contain a primed SV (dark gray circles) and pVr1 is indicated as a number. Initially empty release sites are indicated by dashed black squares. The larger dashed, blue circle in the AZ center indicates pVr1 = 0.25. Second row: After AP1 some of the SVs have fused (dashed blue circles). Third row: Right before AP2 the initially empty sites as well as the sites with SV fusion in response to AP1 have been (re)populated (orange shading). pVr2 is indicated as a number. The larger dashed, red circle indicates pVr2 = 0.25. Bottom row: After AP2 the second release has taken place. Small, dashed circles indicate release from AP1 and AP2 (blue and red resp.). (B) The average simulation at the same time points as in (A). Histograms represent primed SVs (black and gray) as well as first and second release (blue and red) illustrating how release from AP1 and AP2 draw on a larger part of the SV distribution (compare to Figure 5) and how the increase in RRP size can induce facilitation. The blue and red curves indicate the vesicular release probability as a function of distance during AP1 (blue) and AP2 (red). Parameters used for simulations can be found in Tables 1–3.

