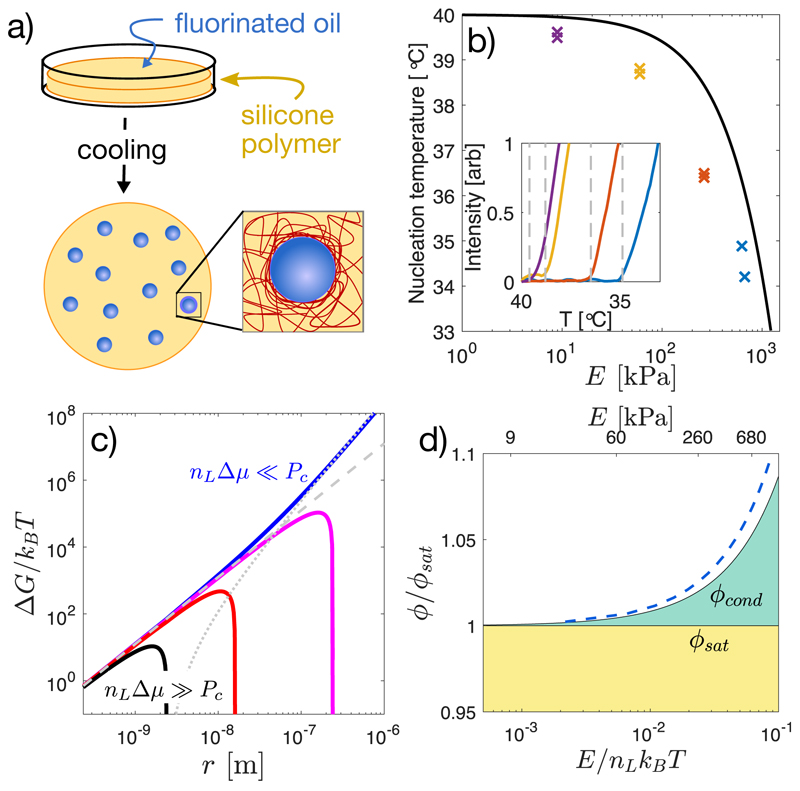
Fig. 1. Network stiffness controls droplet nucleation.
(a) Schematic diagram of the method for nucleating and growing droplets in a polymer network. (b) Measured nucleation temperature for samples saturated at Tsat = 40°C and cooled down at 0.2°C /min, as a function of Young’s modulus, E. Inset shows the intensity signal used to identify the nucleation temperature. (c) Free energy landscape of a growing droplet, as given by Eq. 1. Here, E is set at 300 kPa, rm ≈ 2.4 nm, γ = 4mN/m [10] and the driving pressure nLΔμ is varied from 50 kPa (blue line) to 5 MPa (black line). Contributions from surface tension and elasticity are shown as dashed and dotted lines, respectively. (d) Fixed-temperature phase diagram showing the stability of the mixture with concentration and network stiffness. Mixtures are stable in the yellow region, unstable in the white region, and stable against droplet growth but unstable to demixing at the boundaries in the green region. The solid black curve for ϕcond is given by Eq.2, assuming elastic cavitation and dilute solution approximation for Δμ. The dashed blue line shows a non-dilute version of the theory with ϕsat = 0.036, as described in the Supplement.

