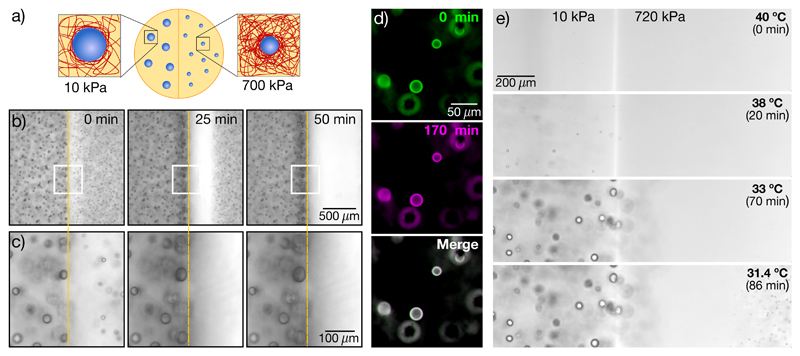
Fig. 2. Stiffness gradients drive solute transport and ripening.
(a) Schematic showing liquid droplets generated in a stiffness gradient. (b)-(c) Time-lapse bright-field images (10X NA 0.3) showing dissolution of droplets on the stiff side (E = 700kPa) and growth of droplets on the soft side (E = 10kPa). White boxes in (b) are shown at higher magnification in (c). (d) False color images of bi-disperse droplets grown in a homogeneous network with E = 80 kPa. Green(magenta) panels show the sample at the 0(170) minute time point. The merged image shows almost complete overlay of the two channels (seen as white) (e) Side-by-side gradient samples of stiff (E = 720kPa) and soft (E = 10kPa) cooled down at a rate of 0.1°C /min. Orange dashed lines in (b),(c) indicate the interface between stiff and soft sides.

