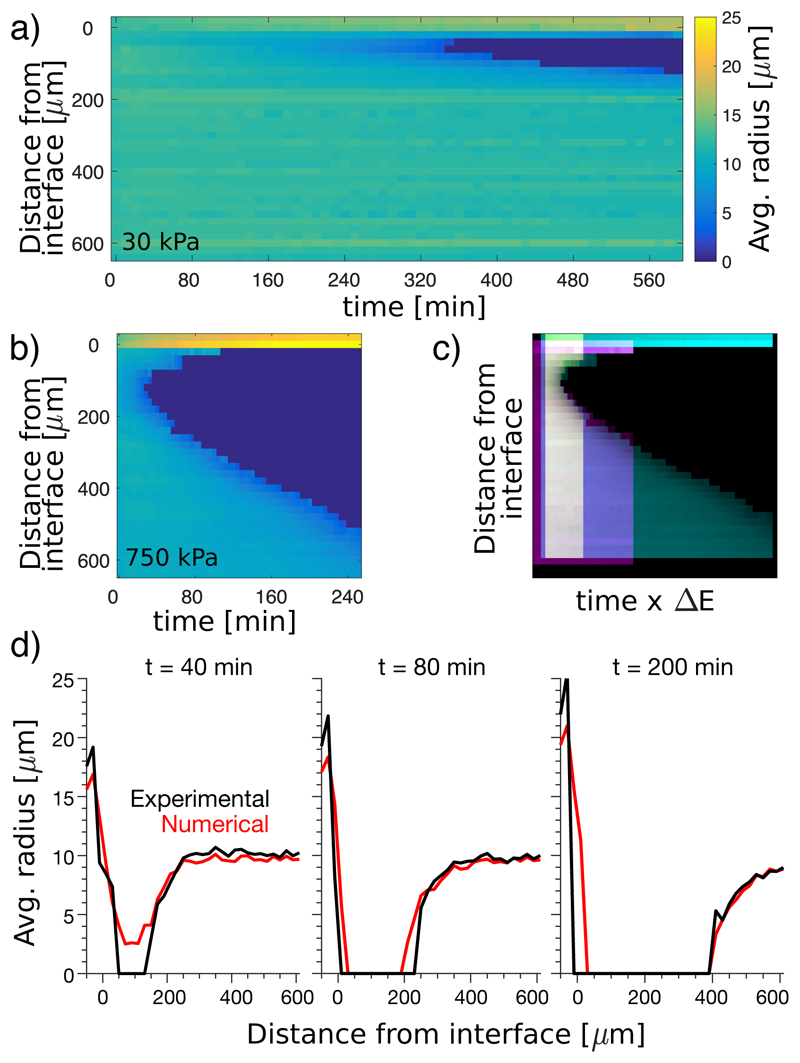
Fig. 3. Rate of ripening increases with stiffness difference.
(a),(b) Kymographs showing average radius over time of droplets at different distances from the soft-stiff interface. The ‘soft’ sides (z < 0μm) have E = 7 kPa. ‘Stiff’ sides (z > 0μm) vary from E = 30 kPa in (a) to E = 750 kPa in (b) (further data Fig S10). (c) Superimposed kymographs with stiff sides of E = 140kPa (yellow), E = 330kPa (magenta), and E = 750kPa (cyan), where the time-scale is multiplied by the elastic modulus difference across the interface, and shifted so that the starting points are aligned. (d) Numerical simulation of 750kPa sample, shown with experimental data (see Movie S5 for further time points). Here, the simulation is based on simple diffusion in the dilute phase with the internal droplet pressure set by the stiffness of the gel.

