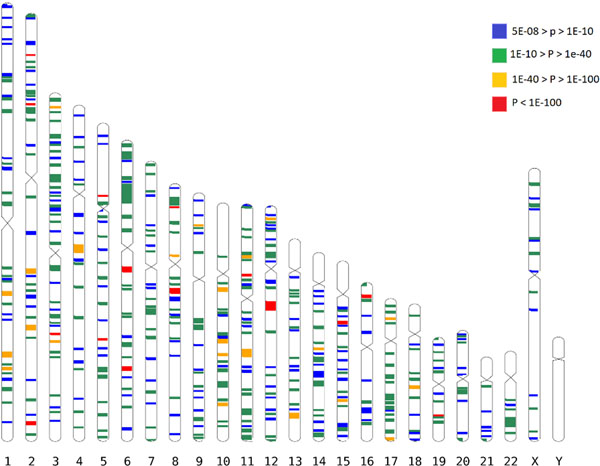
Figure 1.
All GWAS-associated regions from the main meta-analysis. Each band is a true scale of genomic regions associated with refractive error listed in Supplementary Table 1 (+250kbp on each side to make smaller regions more visible). The different color codes represent the significance (p-value) for the genetic variant within that region that displays the strongest evidence for association.

