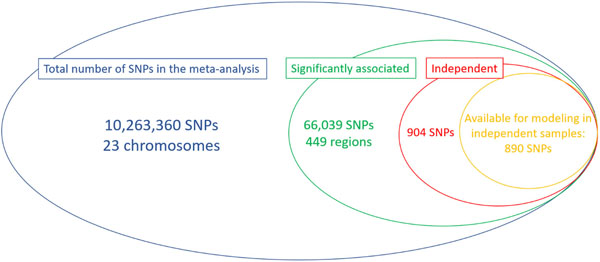
Extended Data Fig. 8:
Venn’s Diagram of the number of SNPs considered in each of the stages of this study. The different circles represent various stages, inclusion in the meta-analysis (blue), identification of significant loci (green), conditional analysis results identifying independent effects (red) and the total number of SNPs available for inclusion in prediction and heritability estimation in the independent (i.e. not part of the original meta-analysis) EPIC-Norfolk cohort (orange).

