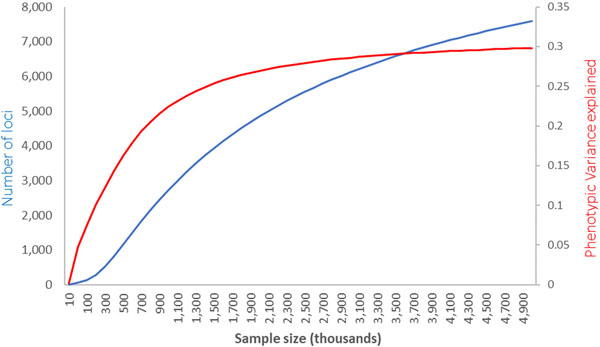
Extended Data Fig. 9:
Prediction for the total number of SNPs and phenotypic variance explained as a function of GWAS sample size in future studies, based on the distribution of effects observed in the current meta-analysis. The plot lines show the predicted relationship between the number of loci associated with refractive error (left vertical axis, blue line) and the variance they help explain (red line, right vertical axis), as a function of the sample size (x-axis) used in future GWAS or meta-analyses. These projections are consistent with the observed results, where an effective sample of 379,227 identified 904 independent signals after a conditional analysis, explaining 12–16% of refractive error variability.

