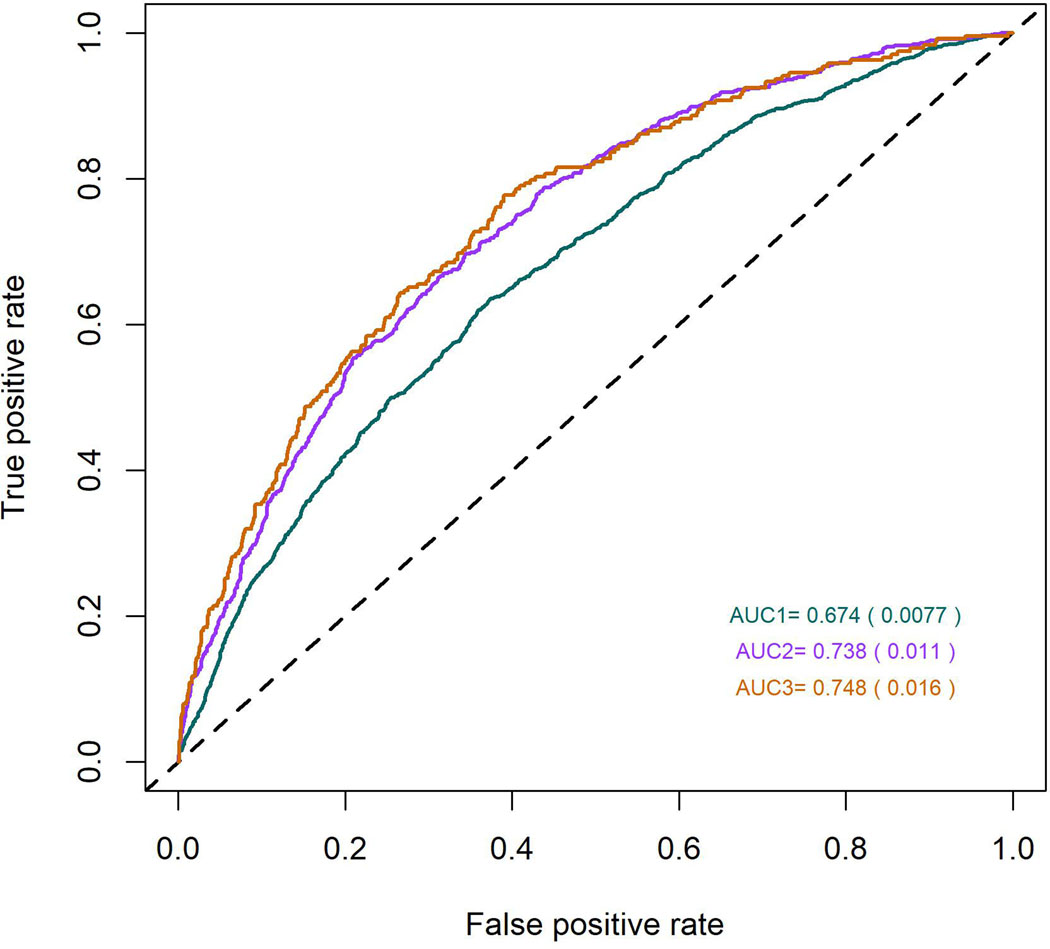
Figure 2.
Receiver Operating Characteristic (ROC) curves for myopia predictions, using information from 890 SNP markers identified in the meta-analysis. The three different colors represent three different curves for each of the different definition of myopia: green – all myopia (< −0.75D), magenta – moderate myopia (< −3.00 D) and brown - severe myopia (defined as < −5.00 D).

